Introduction; Stock Fundamental
Stock fundamental analysis serves as the cornerstone for long-term investing. Stock investors depend largely on basic analysis to determine if a company’s current stock price appropriately reflects its current value. With this stock fundamental analysis cheat sheet, you’ll discover how to turn a stock fundamental viewpoint from your study into a trade.
Though there are several approaches to stock trading, the two most common schools of thought are fundamental and technical analysis. After you grasp how the stock market works and how a company is valued, you will see the importance of fundamental research.
Stock fundamental research’s primary goal is to determine a stock’s intrinsic worth. This can help you determine if a stock is expensive or inexpensive. You can now understand how useful it may be to choose stocks based on basic research.
This fundamental analysis primer is intended to educate investors on the importance of fundamental research.
What is the meaning of fundamental analysis?
Fundamental analysis is the process of studying a company’s financial reports to determine if its shares are a profitable investment. Financial statements for stocks include information on future growth, cash flow, balance sheets, income, profit margins, and other relevant data, in addition to sales.
Investors may use these financial aspects to determine the stock’s intrinsic value. A number of fundamental analysis tools evaluate a corporation based on its financial elements.
Fundamental analysis seeks to establish a stock’s fair value by considering both qualitative and quantitative financial difficulties. We may distinguish between two types of fundamental analysis:
- Quantitative analyses.
- Qualitative analyses.
How should the fundamental study of a stock be interpreted?
As a stock investor, looking at a company’s balance sheet is an example of fundamental research. Looking at the components of a company’s balance sheet, we can readily observe the following three elements:
- The objects that the company owns are referred to as assets.
- The outstanding debts that the firm must clear are referred to as liabilities.
- Capital, often known as owners’ equity, is the amount of money raised via a secondary or initial public offering (IPO).
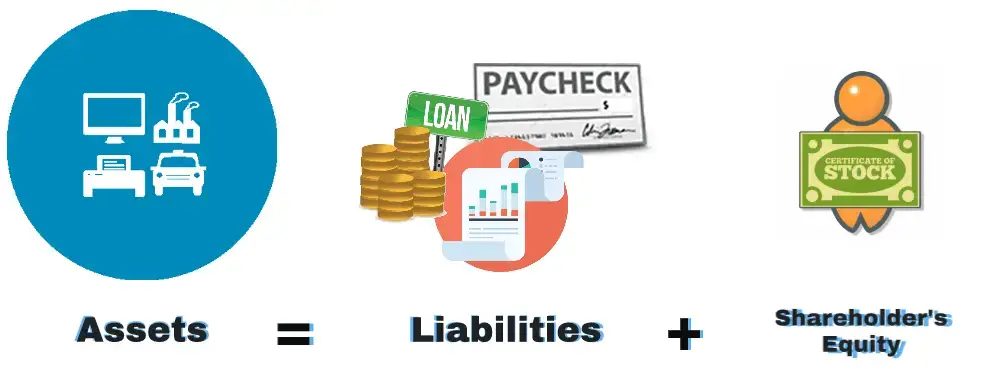
The previously described fundamental analysis approach is a kind of quantitative analysis that uses a company’s measurable components. The qualitative analysis employs less tangible components of a firm, such as board members or brand recognition.
Fundamental analysis should offer answers to any question concerning the status of a company:
- Does the company generate a profit?
- Are the firm’s sales growing?
- What are the company’s future prospects?
- What impact will economic developments have on the company’s future growth prospects?
Why use fundamental analysis in stock trading?
The long-term stock trading strategies utilized by Wall Street’s finest investors depend significantly on stock market fundamentals. Those who invested in long-term growth enterprises based on basic analysis have generated substantial gains.
A strong underlying reason frequently supports and drives any significant upward trend in stock prices. If you understand the underlying drivers of the stock, you will be able to ride the long-term trend more effectively. The fundamental forces, rather than transitory ones, decide whether a stock is a safe investment.
If you want to own your investment in the long term, you must understand the importance of basic analysis.
To get a competitive edge in the market, stock traders typically follow two schools of thought.
We will now analyze whether strategy, fundamental research, or technical analysis, is more successful in discovering trading opportunities in the stock market.
Comparing Technical and Fundamental Analysis: Which Is Better?
Many traders have been drawn into the debate over the advantages of technical vs. fundamental analysis. Much more writing ink has been employed to assist technical analysis, fundamental analysis, or a combination of the two.
William O’Neil, an investor, developed the CANSLIM technique, which combines technical and fundamental analysis to help you choose the best stocks.
Next, we’ll look at the key differences between the two stock analysis theories.
Technical analysis is more suitable for short-term trading strategies, while fundamental analysis is better suited for long-term investments. In essence, this addresses the issue of when to use basic analysis.
Technical analysis is largely concerned with analyzing stock price charts rather than financial data. Fundamental research, from the perspective of an equity investor, seeks to identify companies with the appropriate value and growth potential.
Tired of losing trades? Open a Libertex account to start trading stocks and forex with the professionals today.
Technical stock traders, on the other hand, are solely interested in detecting a profitable stock trading signal. This is accomplished via the use of tape reading, chart patterns, other technical indicators, or a combination of these.
Fundamental and technical analysis primarily seek to assess whether a company’s stock is overvalued or undervalued. They seek in numerous areas an answer to this question.
You can also read: An Introduction to Fundamental and Technical Analysis – Manage Your Risks in Trading
How to Select Stocks Based on Fundamental Analysis
Before making any stock purchases, you should get acquainted with the five most important stock selection criteria. Before making a stock purchase, examine these critical financial figures.
These five stock characteristics may be used to determine a stock’s value and growth prospects. This is hardly the Holy Grail of stock investment, nor is it a foolproof method. However, you may assess the company’s health by reviewing the stock’s financial characteristics.
When acquiring a stock, one should evaluate the following five financial ratios:
- The price-to-earnings ratio (P/E)
- The return on equity ratio (ROE).
- Price-to-book ratio (P/B)
- Equity/Debt Ratio.
- Margin of Profit
We only stressed the most relevant financial data to examine when acquiring stocks, even though additional stock financial measures exist. Understanding crucial investment statistics will help you choose growing firms for your portfolio. If an investor wants to build a profitable stock portfolio, they should employ the stock financial ratios stated above.
1. The price-to-earnings ratio
The price-to-earnings ratio is one approach for calculating how much to invest to get one dollar of a company’s profits. When evaluating a company, investors often look at its P/E ratio first.
The P/E ratio is the price per share divided by earnings per share.
For example, if a corporation is now valued at $100 and had earnings of $4 last year, the P/E ratio would be $25.
What price-to-earnings ratio is ideal?
Everything is predicated on the relative performance of other stocks in the same industry. In general, we look for companies with a low price-to-earnings ratio when compared to other businesses in the same industry.
2. The return on equity ratio
The return on equity (ROE) ratio is a profitability indicator that measures a company’s performance in relation to its equity. The return on equity ratio measures a company’s income production in proportion to its invested capital. This measure is important since it shows how well a corporation uses its investments.
Net income divided by owner equity = ROE.
Investors should spend at least five years evaluating the ROE trend, which should be more than 20%.
3. Price-to-book ratio (P/B)
Warren Buffet employs the price-to-book ratio, sometimes known as the “Margin of Safety,” in his simple stock picking strategy. Buffet learned this concept from Benjamin Graham, the pioneer of fundamental analysis. Warren Buffet believes that the best way to estimate a company’s value is to divide the total by the P/B ratio after accounting for the proportion of net profit and the percentage of dividends paid.
The stock P/B ratio reveals three favorable situations:
- If the ratio exceeds 10, the stock’s price is expected to double.
- If the ratio exceeds 15, the stock price is expected to triple.
- When the ratio exceeds 20, the stock’s value is expected to triple.
4.Equity/Debt Ratio.
The leverage ratio, commonly known as the debt-to-equity ratio, measures how much of a company is backed by debt. The degree of debt in a firm will have a negative influence on its cash flow. Stocks are riskier the more debt a company has on its balance sheet.
Total liabilities divided by equity held by shareholders equals debt to equity ratio.
The debt-to-equity ratio should be less than 1.
5.Margin of Profit
The profit margin ratio is one approach to determine how much profit is earned from sales revenue. Essentially, a company’s stock profit margins reflect its degree of profitability and revenue generating. For example, a company with a 40% profit margin in the most recent quarter would have earned $0.4 in net profit for every $1 in sales.
The profit margin is calculated as net income divided by sales revenue.
To evaluate if profit margins are increasing, stock investors should go back at least five years.
Warren Buffet believes that this is the most accurate way to determine a company’s value. Warren Buffet uses these financial metrics in his stock selection process to find firms with high growth potential. A stock screener can help you quickly and easily choose the most fundamentally sound companies to invest in.
In Conclusion,
It is well recognized that the most successful hedge fund managers are highly talented and educated. Fundamental analysis is another tool in a trader’s toolkit for making sound stock investing decisions.
The best strategy to investing does not include either technical or fundamental examination. It is not uncommon for a stock in the stock market to have a strong fundamental foundation but no tradeable technical pattern.
Fundamental analysis is used for more than just stock market investments. They are used by a wide variety of traders, including cryptocurrency investors, futures traders, and forex traders. Because fundamental analysis is better suited to identifying growing firms, we focused on the equities market throughout this fundamental analysis for dummies course.
Thank you for taking the time to read. Follow for the latest news and information Telegram Channel