

Introduction
A measured move pattern, also known as a measured move setup, is a chart pattern that technical analysts use to detect symmetrical market movements.
In its most basic form, a measured move chart pattern consists of three key components:
1. Initial Move: The pattern starts with an initial price movement, known as the “impulse move” or “leg,” which frequently includes a sharp upswing or downswing. A period of consolidation or correction normally follows the initial surge.
2. Correction or Consolidation: After making an initial increase, prices often enter a period of consolidation or correction in which they partly retrace their earlier move. This stage may feature sideways movement or a retreat from the trend.
3. Measured Moved: Following the consolidation phase, the price reflects the extent of the initial gain and returns to its old trend, either upward or downward. Traders may estimate the potential price target for the measured move by calculating the distance between the initial move and the pattern’s breakout or confirmation.
Trading the measured move has the potential to significantly enhance your trading efforts. The measured move pattern is surprising since it indicates the market’s rhythm. The measured-move pattern technique might help you grasp the distinctive rhythm of each market. Each trading instrument has its own rhythm.
In addition, we will provide you with a very thorough, step-by-step set of directions so that you may trade the Measured Move chart pattern strategy independently.
In trading, what is a measured move?
According to the measured move pattern, an antique chart pattern, the market will most likely move in a price structure similar to its prior moves. In addition to the price difference, the time needed to repeat the same move should be comparable.
The basic premise is that historical pricing behavior often provides insights into probable future price adjustments.
When examining the measured move pattern, the duration of a price movement is equally as crucial as the distance it goes. Essentially, it looks for patterns in which the duration of a previous move and its price structure are quite similar to those of the present move.
If the market has a significant upward trend during a two-week period, the measured move pattern implies that another upward trend of equal magnitude may occur within that time frame. This suggests that not only would the price levels obtained be equal, but so would the movement’s velocity and duration.
Measured changes occur in every market and time period. See below for information on the two types of measured motion patterns. They attempt to predict future price movements by identifying these patterns and using historical precedents to guide their trading decisions.
Notably, these patterns are not infallible and should be used in conjunction with other technical analysis tools and risk management strategies. That being said, they may provide useful information.
You can also Read ,Best Price Action Strategy: Day Trading price Action
Measured uptrend (bullish) pattern.
Assume that the price movement starts at pivot low A and continues to pivot high B. It then drops from pivot B to pivot C before rising again to a new pivot high at D.
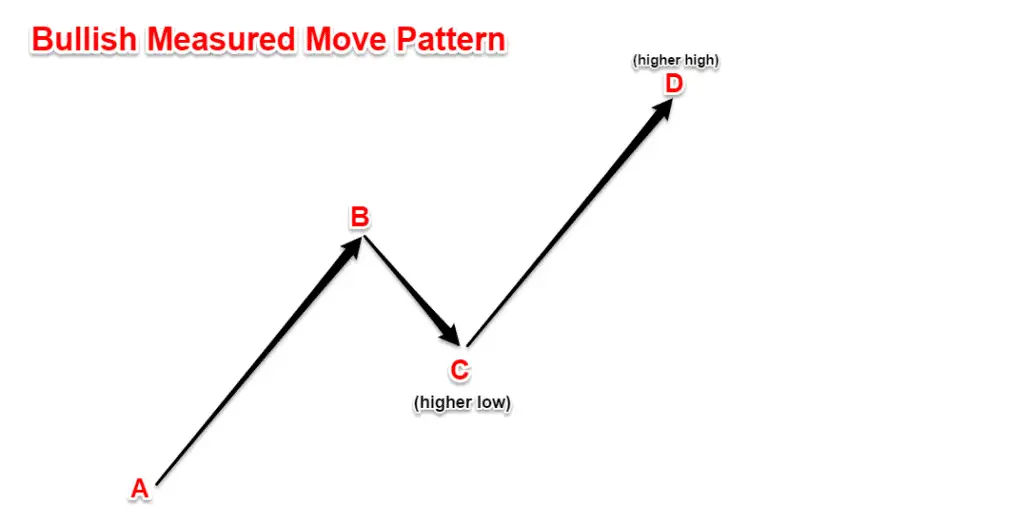
We now call this price action a bullish measured move or the measured move up pattern.
A genuine price structure occurs when pivot D has a higher high and pivot C has a higher low.
You may be curious about how measured motion works. The CD leg is always represented as a percentage of the AB leg, according to the explanation. In a forex measured move, the CD leg and AB move should be equal.
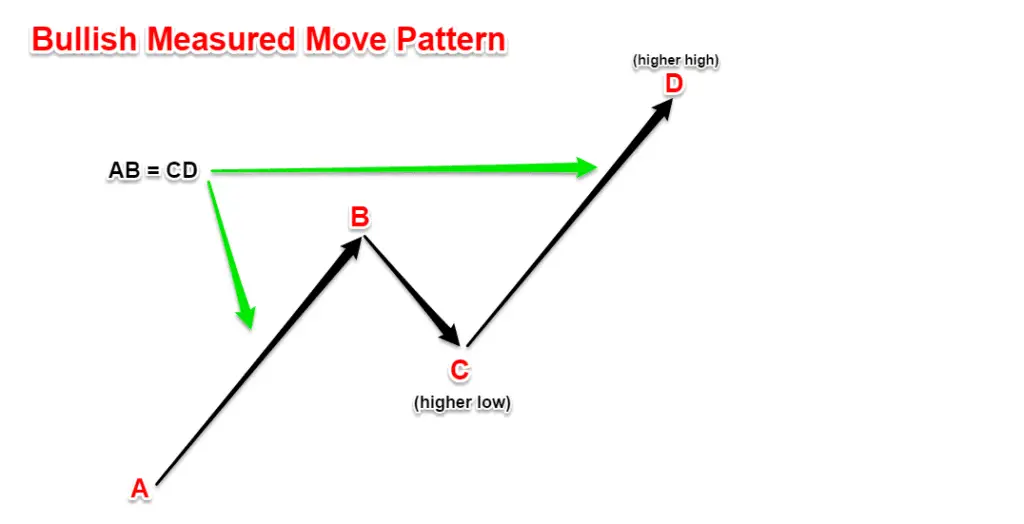
* Based on our personal findings, the CD leg often measures larger than the AB leg.
Move Down Pattern Measured (Bearish)
Consider the following scenario: price movement begins at a pivot high (marked as A), then rallies downward to form a pivot low (identified as B), and so on. It then ascends briefly from pivot B to point C before descending again to form a new pivot low at point D.
This sequence of market moves is referred to as the measured move down pattern, or bearish measured move.
A measured move pattern with a negative trend often includes a lower high at pivot C compared to pivot A and a lower low at pivot D related to pivot B.
The measured move-down pattern moves in the opposite direction as the measured move-up pattern does.
Let’s look at how to trade effectively using the measured move pattern approach and how to trade without using technical indicators.
The explanation for the cautiously hopeful behavior
Trading the measured move pattern allows us to determine the strength and direction of the trend.
The BC retracement indicates where the trend is greatest. As we focus on the trend’s strength and trade the measured move, we will use the 50% retracement of the AB price range as a trading cue.
If Point C closes above Point B and retraces less than half of the AB range, it indicates a strong upswing. If the retracement at Point C is less than 50%, we may conclude that the trend is weak.
Tired of losing trades? Open a Libertex account to start trading stocks and forex with the professionals today.
The FX-measured motion will not be evident until far later in the pattern’s growth. However, after the first leg has risen, we might expect a similar result on the second leg. Trading using the measured move pattern should be straightforward as a consequence.
Measured Move Trading Strategy based on Buy Rules
Using the measured move chart approach is a simple way to benefit from Forex trading. Simply follow this detailed instructions to implement the measured move in accordance with the market rhythm.
Essentially, trading the measured move is an attempt to predict the market’s forthcoming movement after a price event.
Next, we describe the buy-side fundamentals of the measured move method as follows:
1. Recognize the rally.
To recognize the rally, you should be able to see a sequence of higher highs followed by a series of lower highs.
The phrase “measured move” in Forex refers to a positive trend that persists during the first stage. When determining an uptrend or bullish trend, we look for a pattern of higher highs and higher lows.
2. Retreat.
When the retracement against the first leg higher exceeds the 61.8% Fibonacci retracement, the measured move strategy is frequently the most effective. The retracement should ideally stay higher than the 32.8% Fibonacci retracement.
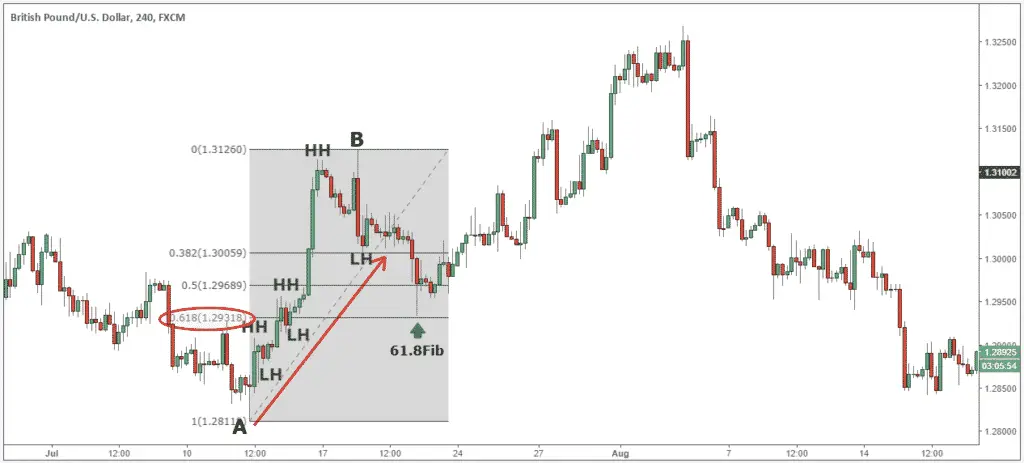
Keep in mind that the retracement remains above the 61.8% Fibonacci retracement, as per the measured move criteria.
The pivot point C indicates the end of the retracement.
So far, everything seems to be going well.
The third part of the measured motion chart plan is now required, as we must describe our entry strategy.
3. Buy the calculated move-up pattern.
The measured move chart method employs a rather basic entry approach.
We want to buy when the price crosses over pivot point B.
The next logical stage in our market trading strategy is determining where to take profits.
See below.
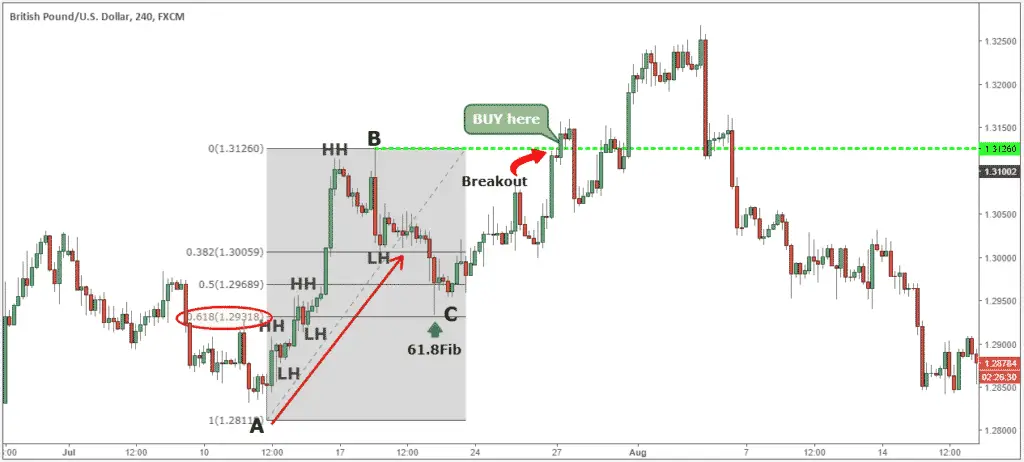
The next logical stage in our market trading strategy is determining where to take profits.
See below.
4.Take Profit.
We can calculate the next leg’s distance traveled and the anticipated time needed to achieve that goal in the case of the observed movement pattern.
To apply the measured move-up pattern in Forex, first calculate the price distance of the AB-leg initial rally and then project that price distance higher, starting at pivot point C.
This method may be used to identify the likely aim for the measured move chart pattern.
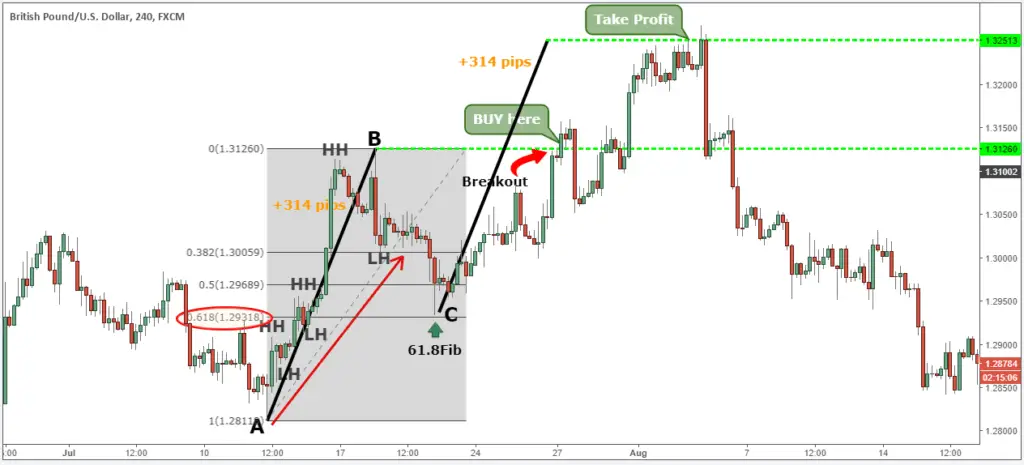
Any geometrical price movement may be evaluated using the measured move concept. It’s also a great trading approach for improving your exit plan.
5. Stop Loss Involvement
When trading the measured move, one common approach is to hide your protective stop loss immediately below the pivot point C.
Alternatively, you may take a much greater stop loss by using one of the other stop loss techniques, which involves placing the stop loss below pivot point A.
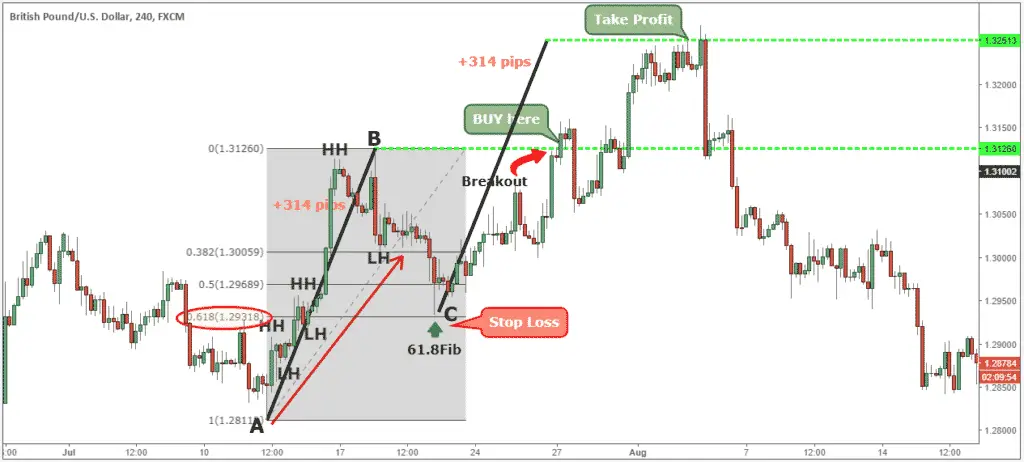
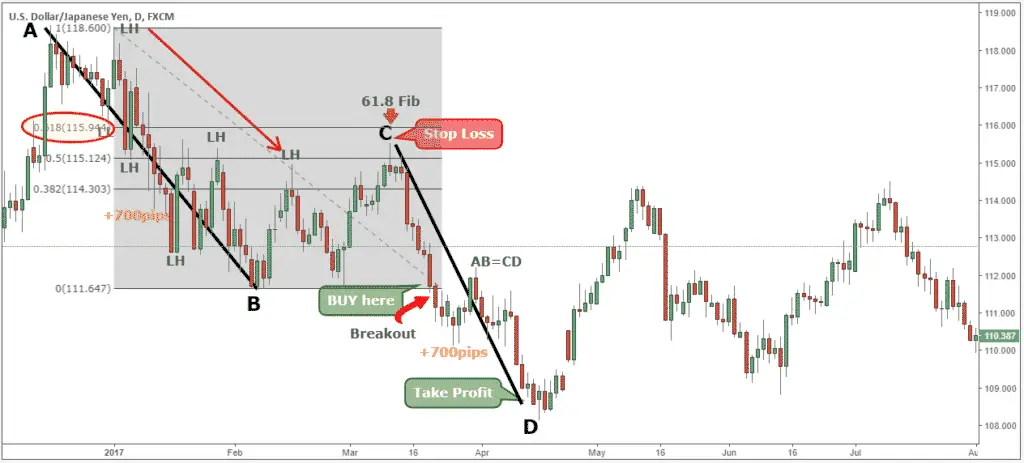
Note: The aforementioned trade is an example of a measured rising up pattern buy transaction. Apply the same rules to a measured move down pattern SELL transaction, but in reverse.
Using this innovative and cutting-edge form of technical analysis, the figure below shows a real measured move down pattern in a in a SELL trade example.
In Conclusion,
You can apply an unusual trading strategy to your own trade: the measured move chart pattern technique. While it is hardly the Holy Grail of trading methods, this strategy might be quite beneficial in determining potential profit targets.
The bullish measured move is simply a trend continuation candlestick pattern that can be applied to any time period.
When you trade the measured move, you will no longer be trading on random numbers, allowing you to stay in sync with the market’s rhythm.
Thanks for reading! Follow for the latest news and information Telegram Channel



