

A rectangle chart pattern is a basic yet efficient tool for traders navigating the frequently volatile world of market trading.
This pattern, defined by the distinct rectangular shape formed by price fluctuations, is an important predictor of future market movements and turning points.
Rectangle chart patterns are simple to understand and utilize, allowing traders to make better judgments by predicting market movements.
This article investigates the relevance of this pattern in real-world circumstances and makes recommendations for developing effective trading strategies.
We want to demystify this technique and make it accessible to traders of all skill levels by giving short explanations and real-world examples.
Rectangle Trading Pattern: What Is It?
The rectangular pattern implies both a trade reversal and a continuation. However, when used as a continuation pattern, the trend’s force works in your advantage, increasing its strength. Keep in mind that this is one of the best ways to start employing a breakout strategy when trading Forex.
Remember that this trading approach is neutral in terms of patterns, with neither a bullish nor bearish bias. The high probability trade will always follow the dominating trend, but you won’t be able to predict which way it will break until it happens.
The Art of Drawing a Bearish Rectangle Design
To draw the bearish rectangle formation, the following two requirements must be met:
- We must first construct the trend since using it as a continuation pattern generates a lot of money.
- Second, in order to draw two horizontal lines that will restrict price movement, we must have at least two equal (or nearly equal) lows and highs.
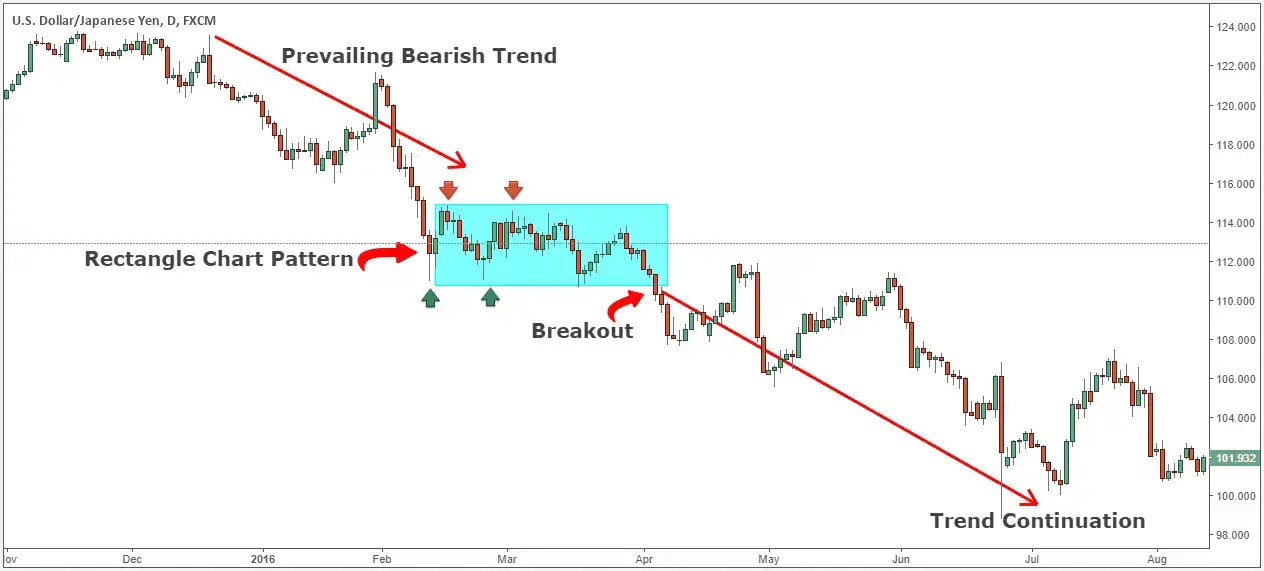
In this pattern, the price action moves flat and horizontally, and it is quite similar to the flag pattern in many aspects.
The Rectangle Trading Pattern Psychology
The double-bottom reversal pattern clearly emphasizes the fight between bulls and bears.
Consolidation inside the rectangle trading pattern suggests that the market is not controlled by a single individual. Not the bears, not the bulls.
The most common mistake committed by retail traders is trading the consolidation price and putting their protective stop loss above or below. For institutional traders who rely on the liquidity these orders provide to execute huge trades, these levels become more important as more stops build above and below the chart.
Rectangle Chart Pattern Strategy: A Step-by-Step Guide
After you’ve gained a fundamental grasp of the rectangle price formation, let us walk you through a simple, step-by-step lesson to help you skim the markets. The trading approach for the rectangle chart pattern is detailed in the next section.
This method is excellent since it makes it quite straightforward to determine whether the currency price will rise or fall.
We are going to show you an innovative way to trade the rectangle breakout. You have access to a previously unknown trading approach.
Let’s begin by going over the Forex rectangle chart pattern step by step.
Step 1: Establish which trend is dominant prior to the rectangle trading pattern. We need a downward trend to sell.
You do not have to join the market and trade this just because you can recognize it via technical analysis of rectangle patterns. Remember that for a marketable rectangle breakout to occur, the right conditions must exist.
The initial step is to determine the market trend before creating the rectangle pricing. We must have a prior decrease in place before we can begin creating a bias for a short position, just as we did with sell orders.
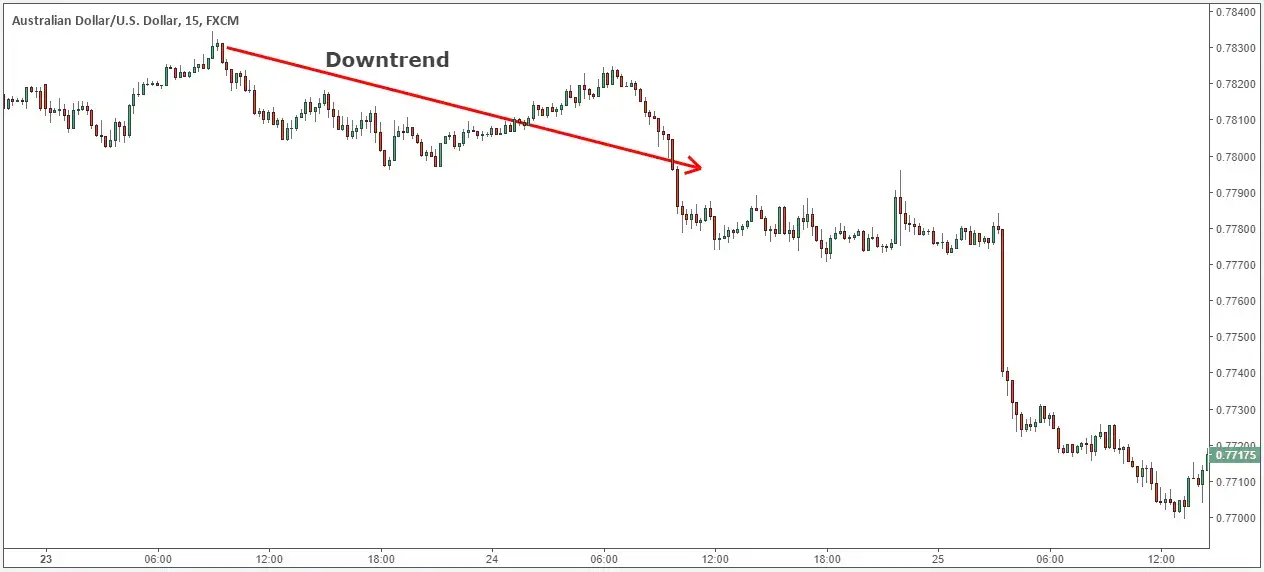
Determining the market phase, also known as the trend, is perhaps the most critical component influencing the rectangle breakout’s success rate.
Step 2; identify the Rectangle Trading Pattern. Prices must move horizontally between resistance and support.
Using the previously mentioned rules, the rectangle price formation may be determined in the second phase.
It is sufficient to identify one support and one resistance level that confine the price activity.
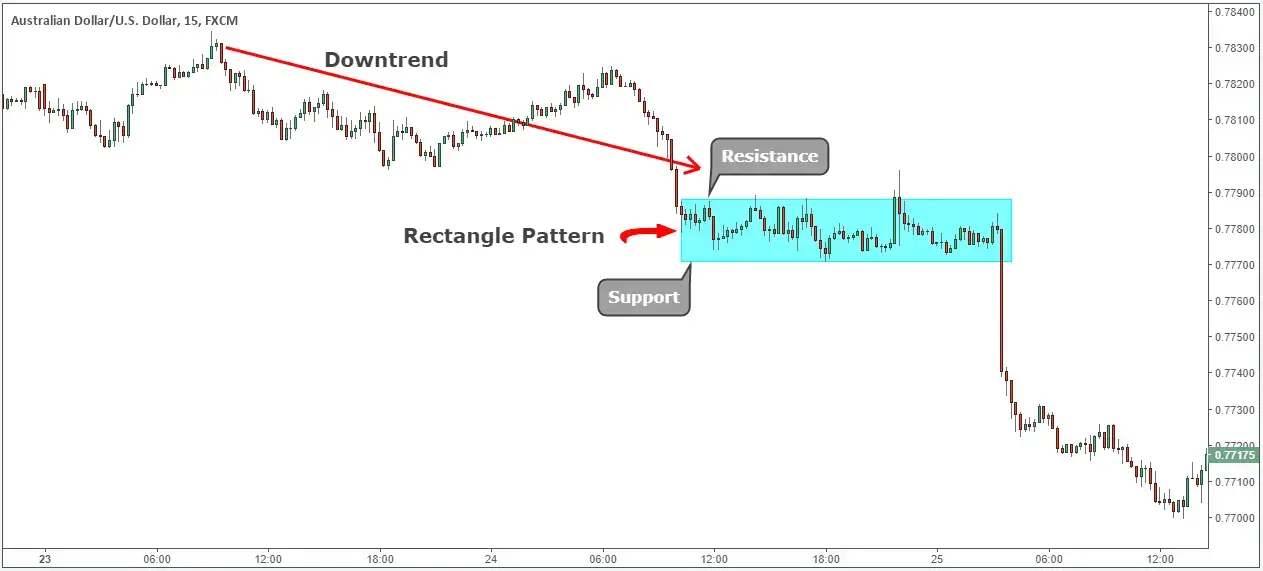
If you are unfamiliar with support and resistance zones, we recommend that you read our other lessons to learn more about Forex and trading in general.
The rectangle fake breakout, which follows in the process of successfully trading the Forex strategy based on rectangle patterns, is what distinguishes this technique.
Step 3: Keep an eye out for an erroneous breakthrough over the rectangle resistance line.
To get an entry confirmation, we usually need to see a break below support for a sell order. Before we get to this point, however, a false breakthrough over the rectangle resistance line would be preferable.
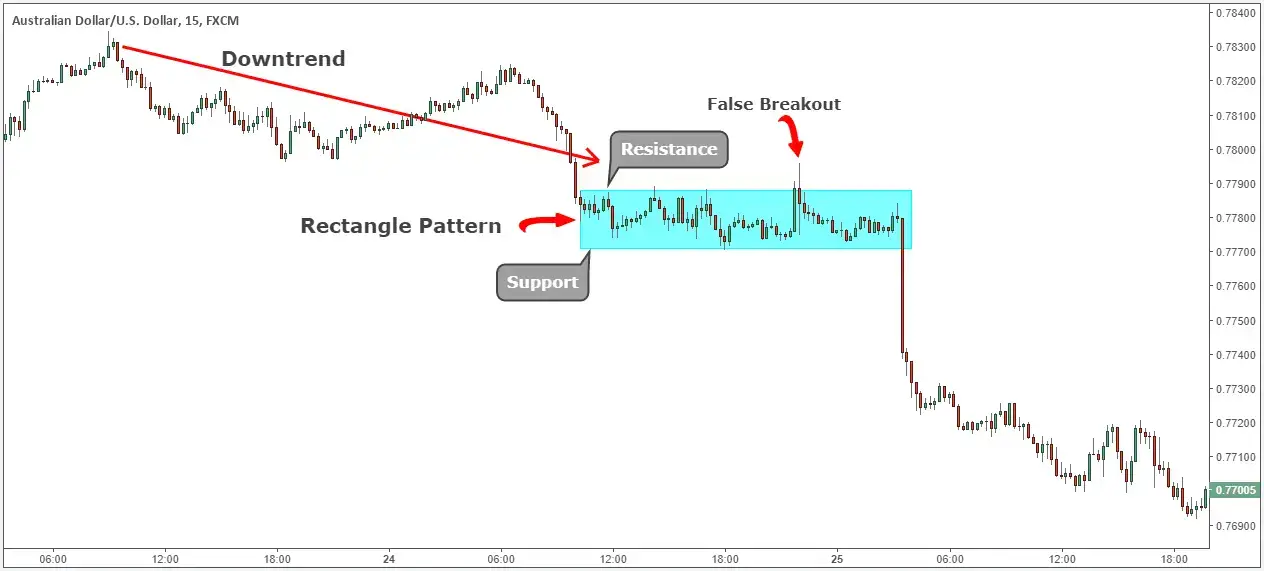
What distinguishes this approach is the rectangular fake breakout that occurs when trading a Forex strategy based on rectangle patterns.
Step 3: Keep a watch out for an unintentional breakthrough over the rectangular resistance line.
We are confined to exchanging high-probability rectangles because to our unique trading strategy.
Normally, we need to observe a break below support for a sell order to get an entry confirmation. A false breakthrough over the rectangle resistance line would also be desired before we reach this stage.
Why does the rectangle chart pattern strategy rely on false breakouts? The false breakaway achieves two goals:
Initially, it prevents traders who have taken a short position against the dominating trend by moving their stop above the previous resistance level.
Furthermore, it captures specific buyers who join the trade at the resistance level.
These activities will enhance the downward momentum when the rectangle breakout occurs.
So far, everything seems to be going well.
To get the highest level of accuracy possible, we must now choose an input method.
Step 4: SELL at the Rectangle Breakout-Generating Closing Candle.
Following the determination of the market trend and the characteristics of a well-designed rectangle pattern, we must await proof that the trend will continue.
Rectangular breakout candles support and validate our entry point, signaling that the trend is likely to resume.
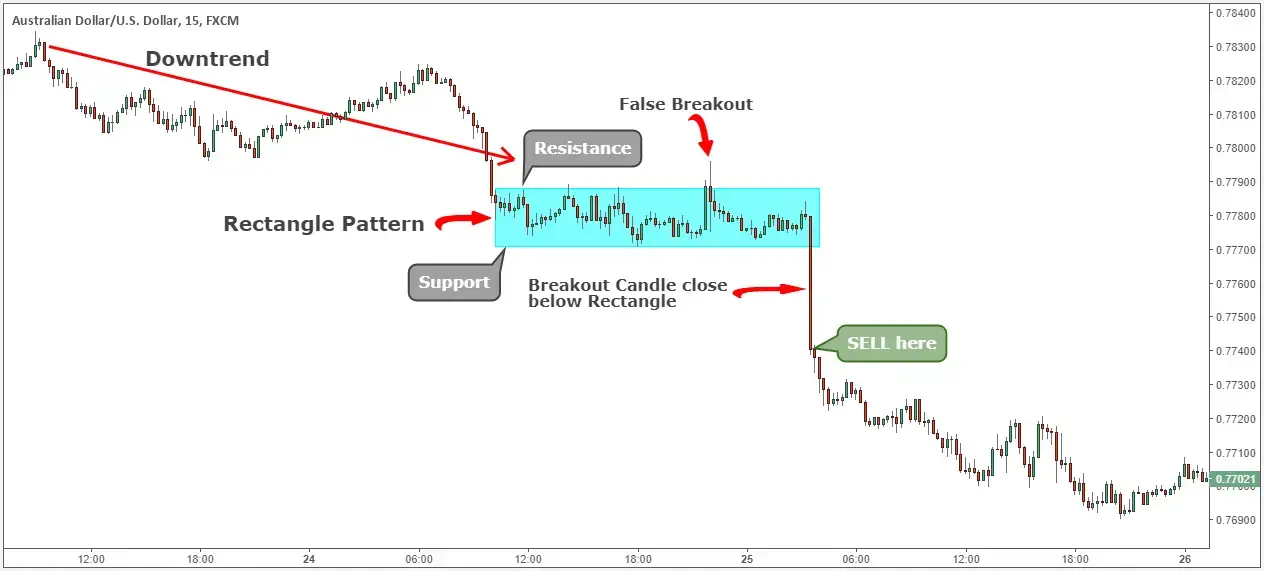
Instead of speculating, please wait for price action to reveal our route. When trading using the rectangle chart pattern, you want to be a selling when there is a breakout below the rectangle bottom.
When the rectangle breakout happens, it confirms that the bears have taken control the market.
Note: It is advisable to wait until the breakout candle closes below the rectangle-shaped chart.
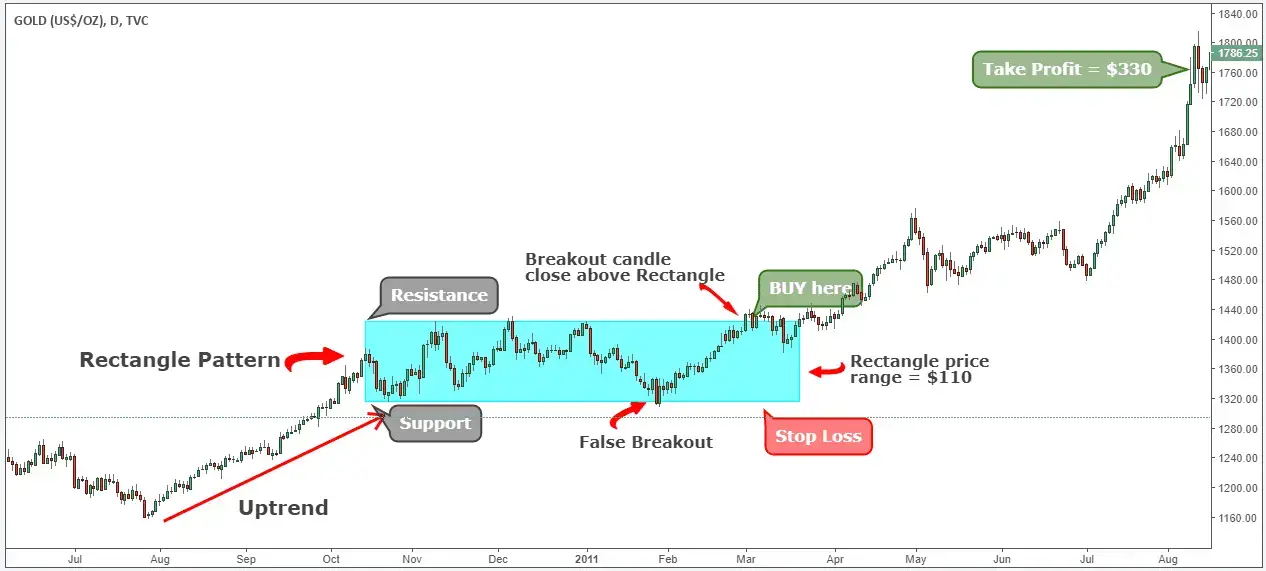
Step 5: The rectangle price range, measured from top resistance to bottom support, might be 2-3 times the take-profit goal .
Using this particular pattern, you may determine a goal for the price’s predicted gain after the rectangle breakout.
The guidebook proposes calculating the spacing between the two parallel lines and adding that value to the breakout to calculate your profit target.
We also need to decide where to put your protective stop loss, which is another crucial issue.
Tired of losing trades? Open a Libertex account to start trading stocks and forex with the professionals today.
Step 6 :Place the Protective Stop-loss. little higher than the Rectangle Resistance Level.
Setting your protective stop-loss a little bit above the rectangular pattern allows you to easily calculate risk using the technique. The risk-to-reward ratio is a technique that you can learn about here.
We always want to minimize losses, therefore it’s excellent that the rectangular trading platform also lets you trade with a tight stop loss.

Note: The example of a SELL transaction is presented above. For a BUY transaction, the same rules apply, but in reverse. The image below shows a real BUY trade example that uses the bullish rectangle pattern.
In conclusion, the trading strategy for rectangle pattern
The rectangle top chart pattern’s popularity and broad use may be traced back to its ease of recognition on a price chart. Unlike an indicator, which lags, this gadget works in real time. As a result, the rectangle pattern is more powerful than indicator trading.
Furthermore, we’ve had some success trading the rectangle breakout throughout the years, so this pattern is rather undervalued.
Also, remember to review our previous double bottom approach instructions.
Follow for the latest news and information Telegram Channel



