

What is an option chain?
Understanding how to read and evaluate options chains is critical for new investors in options trading. These show all of the available option contracts for certain securities, usually in a tabular style that categorises
contracts according to the strike price and expiry date. The tool displays a multitude of information on both call and put options, such as implied volatility (IV), trading volume, and current price.
Being able to properly traverse an options chain may considerably increase your ability to trade these derivatives and discover market opportunities, even if the large list of prices and other data seems to be too hard at first. As options continue to gain popularity among individual investors, anybody wishing to broaden their trading methods beyond standard stock investing must understand the complexities of the options chain.
Key Takeaways
- An options chain lists all available option contracts for a security, organised by strike price and expiry date.
- An options chain generally displays each contract’s bid price, ask price, volume, open interest, and implied volatility.
- Understanding “the Greeks” (delta, gamma, theta, and vega) in an options chain may help you determine market risk and possible profits.
- Option chains may be used to identify trading opportunities, such as mispriced options or advantageous risk-reward situations.
- Most online brokers and financial platforms provide options chain data, frequently with customisable views and filters.
Gaining Knowledge of Option Chains
Options chains include a list of all option contracts that are available for a certain underlying security. It provides traders with a brief summary of key facts about each contract, such as market prices, expiration dates, and strike prices.
In options chains, there are separate sections for call and put options, which are often organized in a tabular format. The columns display the multiple data points from each contract, while the rows represent the varied strike prices. This allows traders to make well-informed decisions by quickly comparing options with different qualities.
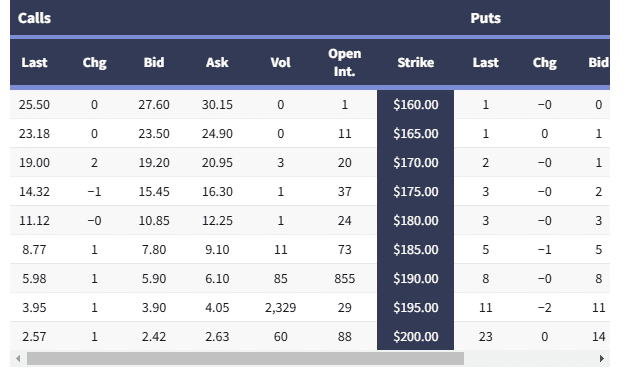
Example of a GE Options Chain Table.
This options chain table is useful for traders looking at prices for GE options that expire in three weeks. Here are some crucial points:• Each row displays current pricing, trading activity, and open interest for a specific strike price.
• The price per share does not apply; each contract covers 100 shares. To control 100 shares, for example, would cost $6,155 (61.55 x 100) if the offer was 61.55.
• The Bid and Ask columns represent the market for acquiring or disposing of the option.
• Volume reflects the trading activity for the day.
• Open Interest, often known as Open Int, represents the number of unsettled contracts.
• The Change and % Change columns represent the price movement of the option for today.
• More liquid options, which often have lower bid-ask spreads, are characterised by more volume and open interest.
Decoding the Option Chain
As seen in the example chart above, the columns of an options chain consist of the following:
- The striking price is the price at which the option holder may either purchase (call) or sell (put) the underlying asset.
- The expiry date is the final day the option contract is in force.
- The bid price is the utmost amount a buyer is prepared to pay for an option.
- The ask price is the lowest amount that the seller is prepared to accept for the option.
- The last price is the option’s most recent trading price.
- Percentage change The net change column shows both the magnitude of the price change and the direction (up, down, or flat) of the underlying asset.
- The volume refers to the total number of contracts exchanged during the current session.
- Open interest refers to all outstanding contracts.
Tips:
Every professional option trader must be able to read option chains. It is the confluence of trade opportunities, pricing inefficiencies, and market sentiment.
In the world of option trading, knowledge is power. An investigation of an option chain may identify market inefficiencies that savvy traders might capitalise on. By examining the bid-ask spread across several strike prices, you might find more liquid alternatives. Open interest may also provide additional information regarding market mood.
An experienced user can rapidly understand an options chain to determine where there is high and low liquidity, as well as what it means for price changes. The greatest traders must be familiar with this information. Let’s separate the remaining choices chain tables into digestible chunks for those who aren’t quite there yet:
- Calls and puts: Call options, which offer the right to buy, and put options, which provide the right to sell, are often differentiated in option chains. Because of this divide, traders may choose to concentrate on bullish or bearish methods straight away.
- Customisation and filters: The majority of trading systems allow you to alter the presentation of your option chain. To rapidly locate the most relevant contracts, filter by the strike price range, expiry date, or certain Greek values.
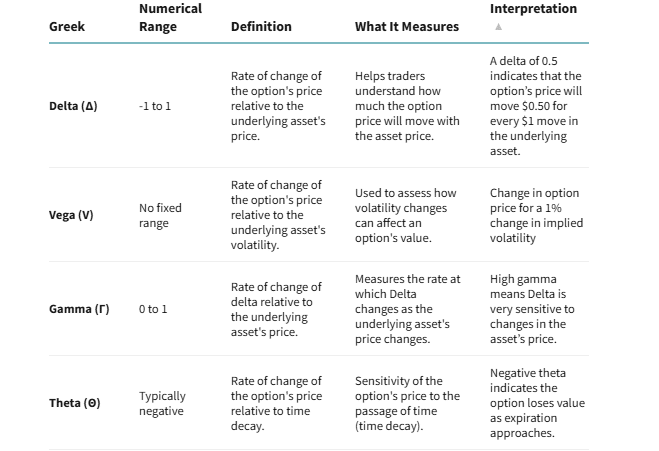
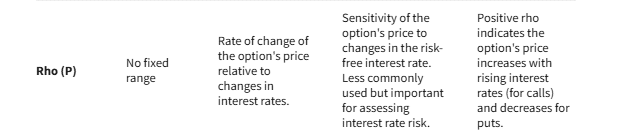
- Greeks: Many options tables, including those on TradingView, include Greek variables such as delta and gamma. These describe how the option’s price may fluctuate under certain scenarios. Here’s a summary of how to take advantage of the Greeks.
Know your options,Greek
The “Greeks” are essential risk indicators used in options trading to anticipate possible price fluctuations under various conditions. The five major Greeks, their measures, and interpretations are listed here.
- In-the-money (ITM) vs. out-of-the-money (OTM) comparison: Colour coding is often used to identify ITM and OTM options. This visual indicator enables traders to rapidly determine an option’s intrinsic value.
Tip: There is no uniform colour designation for option chains. Although many platforms use green for calls and red for puts, be sure to double-check the legend.
- IV: A measure of how the market anticipates future price movements.
- When comparing IV across various strikes and expirations, one may get a lot of knowledge about market expectations.
When evaluating liquidity, open interest and volume are useful metrics. Options with greater numbers are easier to trade and have lower bid-ask spreads.Tired of losing trades? Open a Libertex account to start trading stocks and forex with the professionals today.
Analyzing Option Chains for Profitable Trades
After learning the interpretation of an option chain, the next step is to maximise this knowledge. When examining your options chain selections, you must do the following actions:
Evaluate the liquidity.
Look for options with tight bid-ask spreads and high volume. Trading them is often easier, and the execution price is frequently higher. A $1.00 bid and $1.05 ask option, for example, has higher liquidity than one with a $1.00 bid and $1.20 ask.
Tip: Personal choices should not be seen as isolated incidents. Comparing various option types, expirations, and strikes across the chain yields far more useful information.
Consider the IV’s several options.
When you check the IV for various strike prices and expiry dates, you may see significant differences that may suggest that the options are mispriced. Another element that can give possibilities for a calendar spread is a large discrepancy between short-term and long-term IVs.
Furthermore, a higher IV indicates that the market anticipates more large price variations; if you feel the market is overestimating future volatility, now may be the time to sell options.
Evaluate the risk/reward ratios.
Options chains are an effective tool for assessing the possible gains and losses of various strategies.
A Bull Call Spread Options Strategy Example
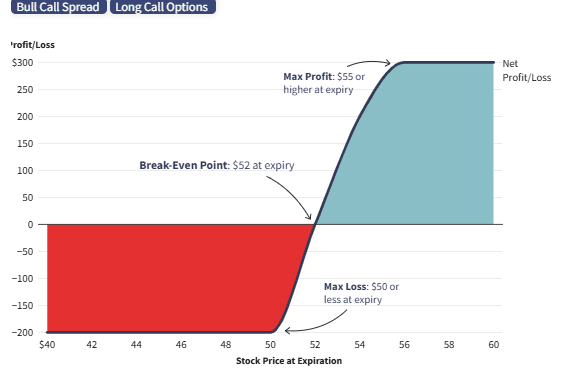
A bull call spread and a basic long call position, for example, might be compared to see which has the most profits.
Below is a chart with “buttons” that compares the two methods:
Choose a Strange Activity.
Look for options with exceptionally high volume relative to open interest. This might be an indicator of market-priced news or institutional trade.
Check out your options, Greeks.
Use the Greeks to determine how various market conditions may impact your position. High gamma options, for example, may experience rapid delta changes when the underlying price changes, which can be risky or beneficial depending on your strategy.
Maintain control of your risk at all times.
Remember that risk management is as critical to effective options trading as opportunity discovery. Always think about the potential negative consequences of the deal, as well as how it fits into your overall budget.
Describe the Option Assignment.
Option sellers must meet their obligations when option holders exercise their right to buy or sell the underlying asset. To reduce the likelihood of this happening, traders may roll options to later expiration dates, close out short positions before they expire, or maintain enough margin in their accounts to cover any potential assignments.
How do dividends affect option prices?
Dividends impact both call and put options. Stocks often lose value by the dividend amount on the ex-dividend date (when receivers are locked in), and call options do the same. Meanwhile, the value of put options may increase.
How does one define a synthetic position in options trading?
This is created by combining options or the underlying asset, and it mirrors the risk-reward profile of another position. To establish a synthetic long stock position, purchase a call option and sell a put option with the same strike price and expiry date. This exposes you to price changes even if you are not really owning a stock.
How Do Option and Stock Market Makers Differ?
Market makers of options face much higher complexity than those of equities. In addition to managing risk across a variety of strike prices and expiry periods, companies must consider IV. To sustain the liquidity of the options market, they so frequently deploy complex pricing algorithms and hedging tactics. However, the major emphasis of stock market makers is on controlling inventories and spreads for particular assets.
The bottom line
Because it gives a full picture of all contracts available for a specific asset, the options chain is vital for options traders. Learning to read and analyze options chains can help you spot trading opportunities, choose an options strategy, and get a better knowledge of market sentiment.
Even though it takes some time to become adept at analysing all of the available data, a complete comprehension of the options chain is required for anybody who wants to maximise the benefits of options trading in their investing plan. You can also read: 5 Simple Steps to Master the Implied Volatility Options Strategy
Thanks for reading! Follow for the latest news and informationTelegram Channel



