

What is Overbought and Oversold?
A very important concept in the Forex market is the oversold and overbought of a currency pair. From the point of view of technical and fundamental analysis, I will try to analyze these concepts from the point of view
Overbought: when the price of a currency pair is too high (overvalued), and its decrease (cheapening) is expected. When there is a critical mass of open buy orders on the market, and players open short deals (sell), the growth of the currency pair slows down and it goes down.
Oversold: on the contrary, when the price of a currency pair is underestimated, it is too low, which suits those who want to buy at that price. There is an increase in the price of the currency pair.
Both of these concepts are reasoning and conjecture! We remember how the dollar at the beginning of October 2014 cost 36 rubles, at the end of 43, at the beginning of November 5, at the beginning of December 6, and in the middle, it jumped up to 78 rubles. And every time we thought that the ruble was undervalued, the pair was overbought, but it still conquered new heights without recoil.
Then where is this overbought? If the USD/RUR has reached 43 rubles, it cannot rise any further. Of course, it can, especially since the movement follows the trend.
You don’t know for sure if the pair is overbought or oversold. And it’s not worth entering the market at every peak or trough. You should analyze from the side of technical and fundamental analysis whether the entry is justified at the moment.
Important: you must understand that being oversold and overbought does not mean that there will be a change in trend. And going against the trend while relying solely on these concepts is risky and reckless.
How to interpret oversold and overbought?
It is worth paying attention only to sharp price jumps; that is, instantly (in a short time) the currency pair has significantly risen in price or fallen in price. This is a clear sign of underestimation or overestimation of it.
See screenshot below, hourly time-frame.
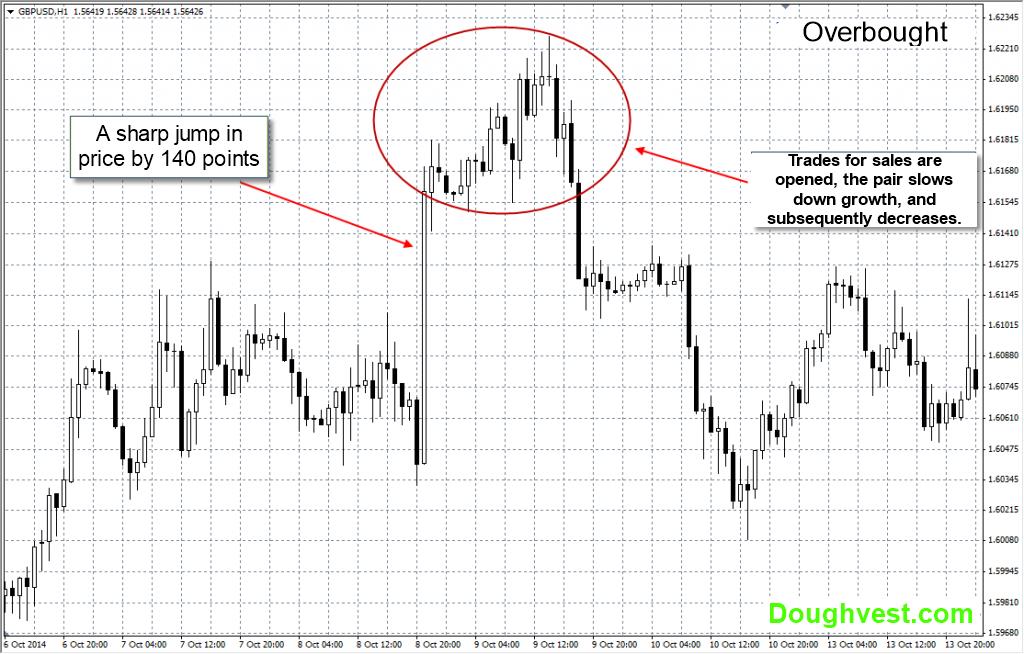
Market players understand that it is not profitable to buy further; the currency pair is overvalued, and growth slows down or stops altogether. Then the bears come into play; they see that the price is profitable for sales and enter the market. The price then rolls back.
It is important to pay attention to fundamental news during such jumps! What could be causing such a dramatic increase in price?Are there any prerequisites for a decrease from the technical side? Maybe it’s just a scam!
It is also worth looking at the levels, whether the overbought and oversold zones coincide with the zones of strong horizontal levels.
Let’s scale down the previous screenshot:
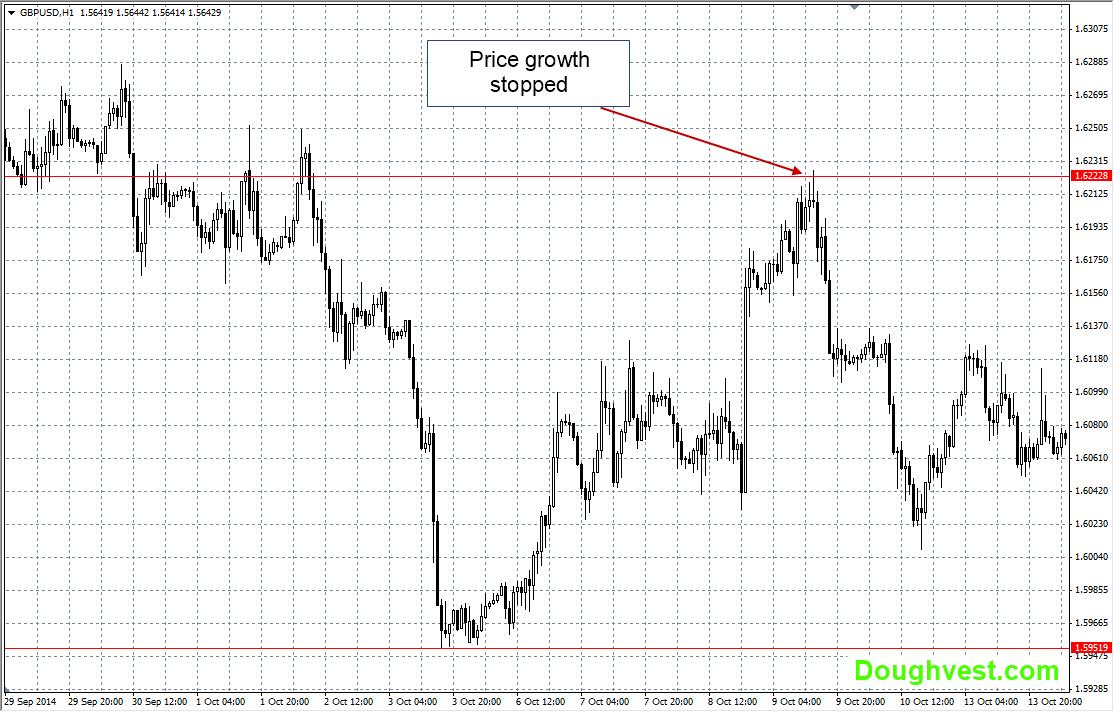
What we see is that the growth of the pair stopped at the horizontal level. After a sharp jump, having tested it, a pin bar formed as an additional confirmation of the downward movement and the rollback was not long in coming.
Indicators to help us!
There are oscillator-type indicators that show overbought and oversold zones.
Let’s consider our case together with the Stochastic Oscillator indicator:

In our example, the Stochastic Oscillator indicator confirmed to us that the pair is overbought and is giving a sell signal.
Taking into account the fact that a pin bar has formed at the top, the base of which rests on the horizontal level, we can confidently enter the market. You can read more about the indicator in the article ” Stochastic Indicator ”
As you can see, knowing these concepts and combining them with other technical analysis tools can increase the accuracy of entering the market.
This concludes my post. I hope I explained everything clearly. Join our Telegram channel for market updates



