

Introduction
Candlestick patterns are one of the most powerful tools in trading. They provide traders with insights into price action, market psychology, and potential trend reversals all at a glance. Whether you’re trading forex, stocks, or crypto, learning how to read candlestick charts can significantly improve your decision-making.
In this guide, you’ll learn what candlestick patterns are, how to interpret them, and the most common bullish and bearish patterns every trader should know.
Tired of losing trades? Open a Libertex account to start trading stocks and forex with the professionals today.
What Are Candlestick Patterns?
A candlestick is a graphical representation of price movement for a specific time period (minute, hour, day, or week). Each candlestick shows:
- Open price – where the market started.
- Close price – where it ended.
- High – the peak price in that time frame.
- Low – the lowest price in that time frame.
The thick part of the candle is called the body, while the thin lines (above or below) are called wicks or shadows.
- A bullish candlestick (often green or white) means the price closed higher than it opened.
- A bearish candlestick (often red or black) means the price closed lower than it opened.
In simple terms: Candlestick charts tell you who’s winning the buyers (bulls) or the sellers (bears).
Why Learn Candlestick Patterns?
Traders love candlestick charts because they:
- Provide visual clarity easy to spot price moves.
- Reflect market psychology (fear, greed, indecision).
- Signal potential trend reversals or continuations.
- Work across markets: forex, stocks, crypto, commodities.
Understanding candlestick patterns helps traders anticipate market direction and improve trade timing.
Key Candlestick Patterns Every Trader Should Know
Here are the most popular candlestick patterns and what they signal:
1. Doji – Indecision in the Market
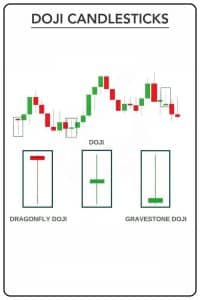
- Open and close are nearly equal.
- Signals indecision; can indicate a reversal or continuation.
2. Hammer – Bullish Reversal Signal
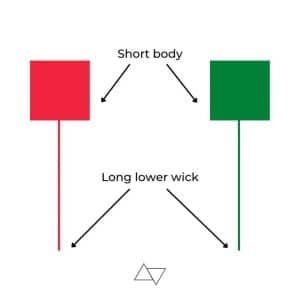
- Small body with a long lower wick.
- Appears after a downtrend; shows buyers stepping in.
3. Shooting Star – Bearish Reversal Signal
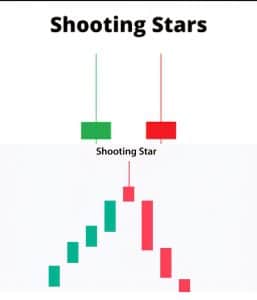
- Small body with a long upper wick.
- Appears after an uptrend; sellers push back strongly.
4. Engulfing Patterns – Strong Reversal Signs
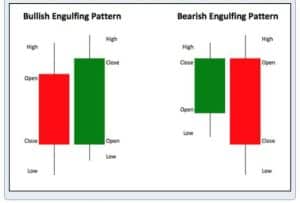
- Bullish Engulfing: Large green candle engulfs previous red candle → bullish trend may start.
- Bearish Engulfing: Large red candle engulfs previous green candle → bearish trend may start.
5. Morning Star & Evening Star – Powerful Reversal Patterns
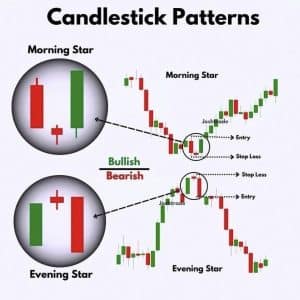
Morning Star: Three-candle bullish reversal pattern.
Evening Star: Three-candle bearish reversal pattern.
How to Read Candlestick Patterns Effectively
To trade successfully with candlestick charts:
1. Identify the trend – Is the market bullish, bearish, or ranging?
2. Look at context – A hammer in an uptrend is weaker than a hammer after a downtrend.
3. Use indicators for confirmation – Combine with RSI, MACD, or moving averages.
4. Check volume – High volume strengthens pattern signals.
5. Confirm across timeframes – A reversal on a 1-hour chart is stronger if it also shows on the daily chart.
Common Mistakes Traders Make with Candlestick Patterns
- Trading patterns in isolation without market context.
- Seeing patterns that don’t really exist (“pattern hunting”).
- Ignoring risk management (stop-loss, position sizing).
- Expecting 100% accuracy—no pattern is foolproof.
Final Thoughts
Candlestick patterns are one of the most effective ways to read market psychology and predict price movement. They help traders identify potential entry and exit points, reversals, and continuations.
But remember: No candlestick pattern is perfect. Use them alongside other tools like technical indicators, trend analysis, and solid risk management.
By mastering candlestick patterns, you’ll be better equipped to read the market’s story and trade with more confidence.
Pro Tip: If you’re serious about trading, practice reading candlestick patterns on live charts. Over time, your eyes will quickly recognize the signals that matter.
Thank you for taking the time to read. Follow for the latest news and information.Telegram Channel



