

Every Forex trader aims to establish successful trading strategies. And, what do you know? You are in luck today! We are delighted to give you access to the best ADX technique created by a professional trader. Our team at Doughvest believes that imitating the behaviors of experienced traders is the easiest approach to financial success.
What is the ADX?
The Average Directional Index, or ADX, is a technical analysis indicator that measures the strength of a market trend. It ranges from 0 to 100, with a value greater than 25 indicating a strong trend and a reading less than 25 indicating a weak one.
The ADIA’s guiding principles are applicable to practically all tradable assets, including equities, mutual funds, exchange-traded funds, and futures contracts. ADX has proven to be quite effective in the futures markets for a variety of applications.
- With an average range of 14 bars, ADX provides a “bigger picture” than many other technical indicators.
- ADX is time-adjusted, so the most recent data is given more weight.
- ADX may be used to determine the strength of a trend in a contract before it is executed.
- ADX facilitates the immediate comparison of mutually exclusive futures contracts.
ADX is a popular statistic among futures traders since it includes historical and current data, as well as future projections. Finding cheap contracts in the current market is crucial for successfully acquiring futures contracts. This is made available for future contracts using conventional ADX metrics.
Moving forward…
Let’s look at some of the most effective ADX trading techniques and how to use the ADX indicator.
View below:
What rules apply to the ADX Indicator Strategy?
Before we go into the criteria for the ADX trading technique, let us describe the ADX indicator and how to use it to your advantage.
The ADX indicator simply indicates whether we are in a trading or non-trading phase and how strong the trend is. To put it another way, the ADX measures trend strength. This technical analysis technique identifies substantial downtrends and makes purchase recommendations.
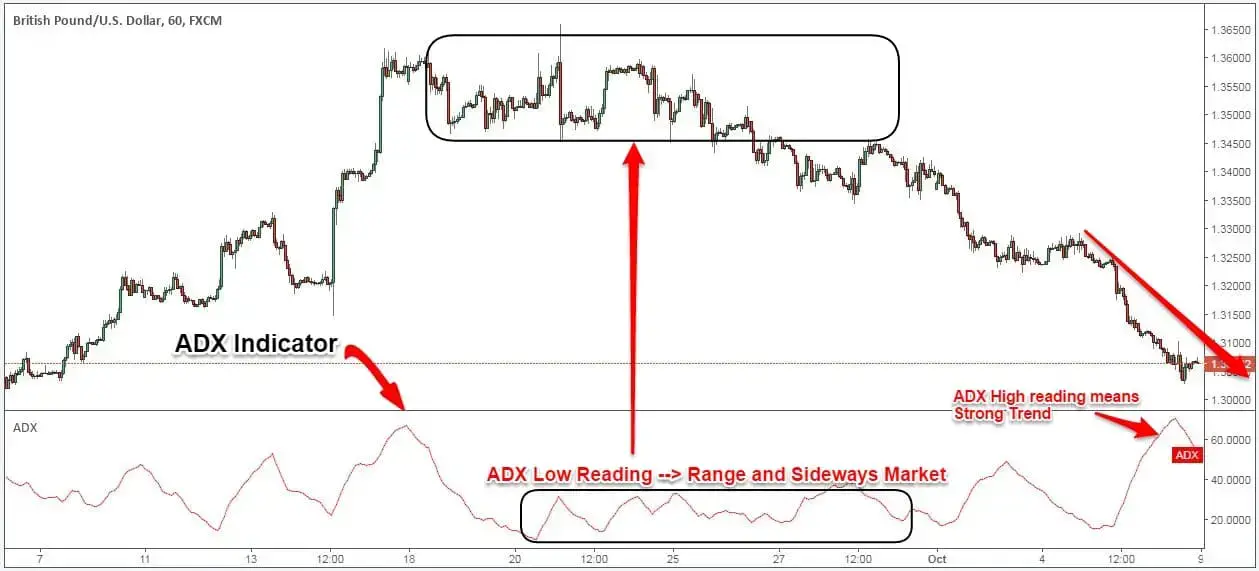
The way we analyze and comprehend the ADX signal requires us to be very cautious. It is neither a positive nor a negative indicator. The ADX moving average simply assesses the strength of the trend.
As a result, if both the price and the ADX signal are rising, we have a strong case for bullishness.
The same is true when the price is falling and the ADX signal is rising. There is a strong argument to be made against it next.
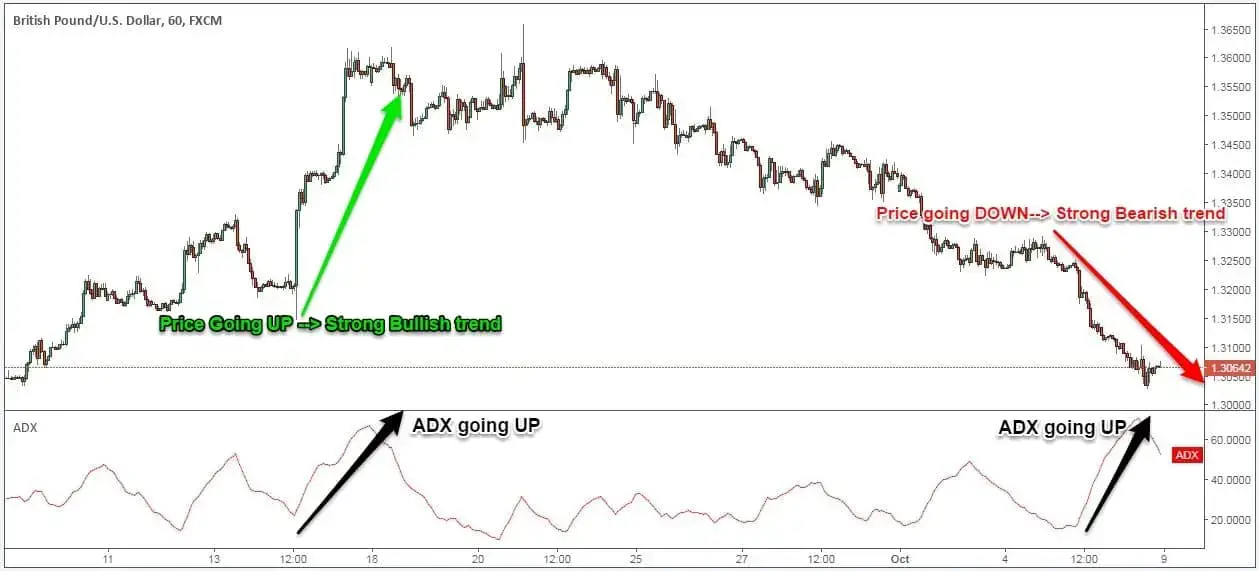
According to the first ADX indicator trading rule, a value less than 25 indicates that the market is range-bound or not trading. The ADX indicator’s second trading rule states that when it is over 25, it indicates a strong bullish or bearish trend.
Going ahead, bear in mind that the ADX indicator does not predict market direction. It simply offers information on the strength of a trend.
Let’s now look at the many trading techniques that employ the ADX indicator.
- ADX indicator for day trading
- ADX indicator for swing trading
First, we will discuss how to utilize the ADX indicator in intraday trading.
How do I utilize the ADX indicator for day trading?
The first step in utilizing the ADX indicator day trading technique is to configure the appropriate parameters.
I will tell you why.
Short-term charts vary quickly; therefore, you will need to adjust the ADX level to make it more responsive to the market’s transitory price swings.
Consequently,
For day traders, the 3-period ADX setting provides the most advantage.
In general, the shorter the duration, the more sensitive the technical indicator is to price movements. The three-period ADX indicator is therefore the most useful for day trading.
Tired of losing trades? Open a Libertex account to start trading stocks and forex with the professionals today.
As we already know, low ADX numbers indicate a weak trend, while high ADX readings indicate a strong trend. Furthermore, when the market naturally swings, prices shift from consolidation to movement, and vice versa.
Now, by merging the two market theories, the following may be determined:
Lower ADX readings (consolidation) should naturally follow higher ADX values (trend).
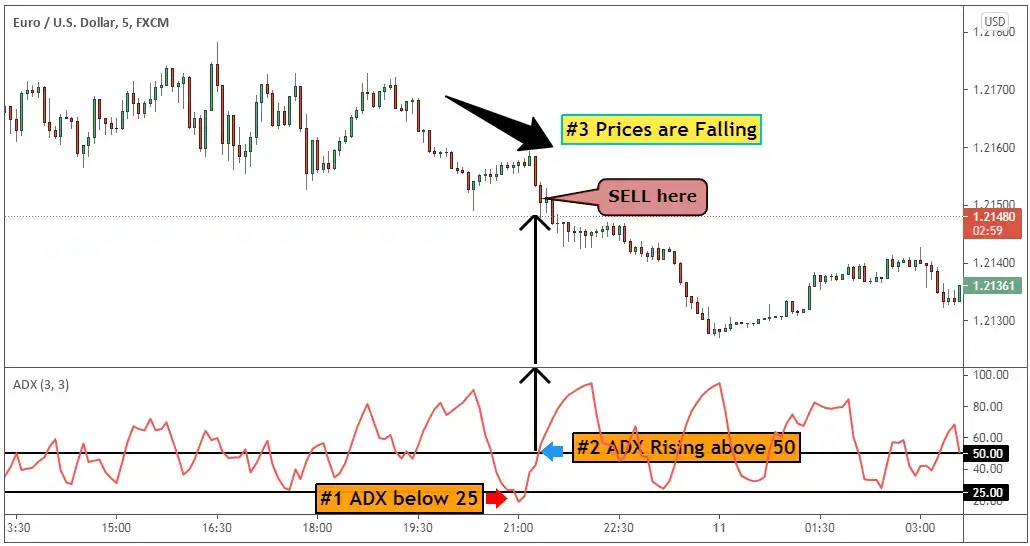
When utilizing the ADX indicator for day trading, we look for buy and sell signals when the ADX dips below 25.
If the ADX falls below 25, it suggests a weak trend and that we are likely consolidating. This suggests that we may look for potential intraday breakout indications.
We wait until the ADX breaks over 50, however, since it does not indicate the trend’s direction:
When the ADX climbs and prices rise, we buy.
When the ADX rises and prices fall, we sell.
A trade example is the most audible thing you can say.
Thus, the following is an example of the ADX day trading approach in action.
The ADX indicator: How to use it Techniques for trading swings
After all, the trend strength indicator is more suited for position trading, making swing trading using the ADX indicator easier.
To apply this ADX swing trading method, follow the basic steps below:
- The ADX must move over 30, since this indicates a rapidly moving market.
- Look for a price retracement to the 20-EMA.
- When the price crosses the 20-EMA, buy higher than the previous bar’s high.
- Put the SL below the recently formed swing low.
What ADX indicator settings work best?
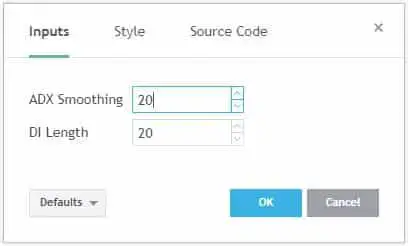
The ADX indicator is based on a smoothing moving average. We discovered that 14 periods is the ideal setting for the ADX indicator. Our ADX indicator settings will provide you with more exact indicators and allow you to place trades faster.
The ADX indicator is best used in combination with other technical indicators.
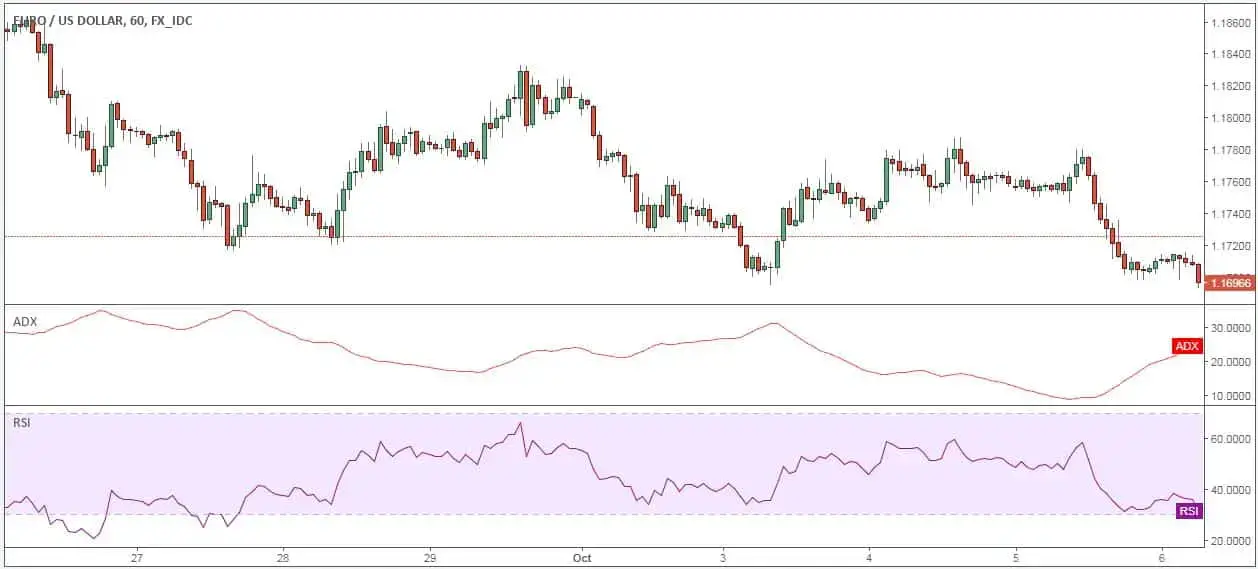
The best ADX technique incorporates the RSI indicator into market timing. The ADX indicator is restricted in its ability to help us determine the strength of the trend. Thus, we need the RSI indicator to provide entry signals.
The ADX indicator and the RSI both have 20-period settings.
Finally, the ADX and RSI indicators should be placed at the bottom of your chart layout. It must be identical to the example that follows.
Best ADX Trading Technique
The ADX indicator method’s recommendations ensure that you trade only when there is a strong trend on the daily or 5-minute charts. From this standpoint, the best ADX strategy is a universal method that performs consistently across all time periods.
Going forward, we will look for opportunities to sell.
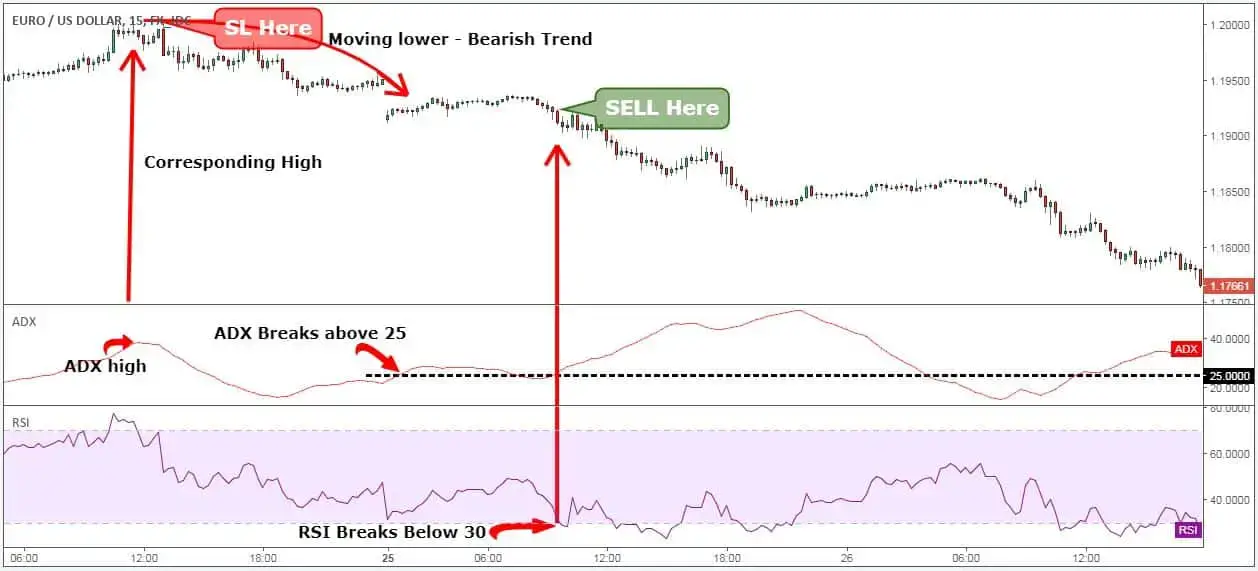
Step 1: Keep an eye out for an ADX rating over 25.
We must wait for the ADX indicator to reach a value greater than 25 before determining whether the market is rising or falling. A value greater than 25 suggests a strong trend and the probability of a trend starting, according to the ADX indicator trading recommendations.
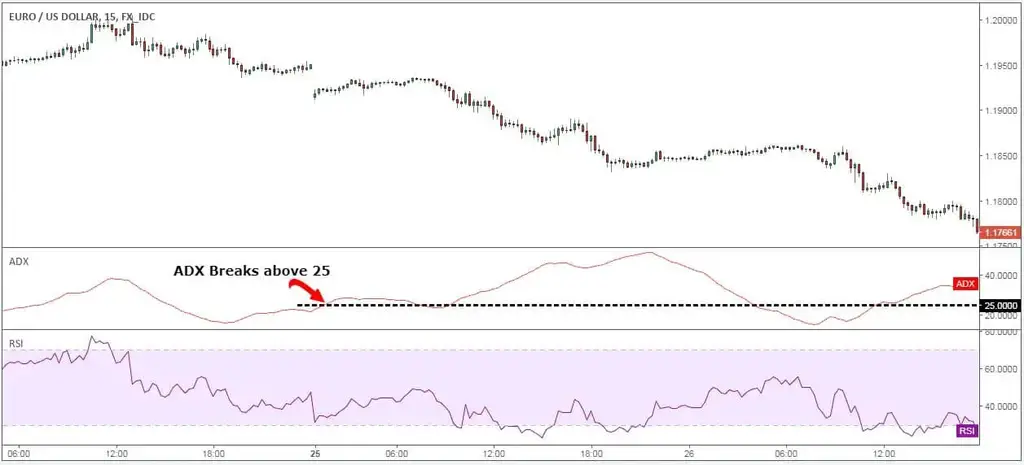
Although trends are often seen as beneficial, they may also vanish quickly if they lack underlying substance.
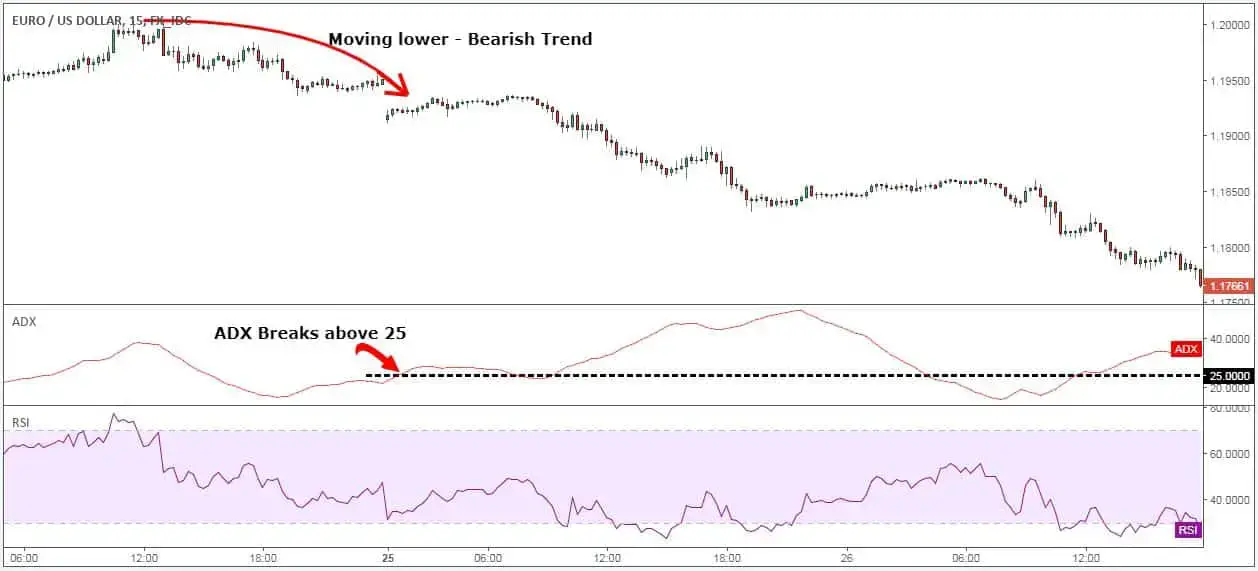
To determine the trend’s direction, we must also examine the actual price movement. This takes us to the optimal ADX strategy’s next phase.
Step 2: Look for a trend using the previous 50 candlesticks. Watch for a negative trend in pricing to indicate a sell signal.
Whatever your time span, we need a workable method to ascertain the trend’s direction.
We guarantee that we trade in the present by using a sample size of fifty candlesticks to identify the trend. Keeping things simple is our preference; therefore, if the price has been declining over the last 50 candlesticks, we are in a bearish trend.
It’s time to focus on the occurrence that will trigger our sell signal for the best ADX strategy.
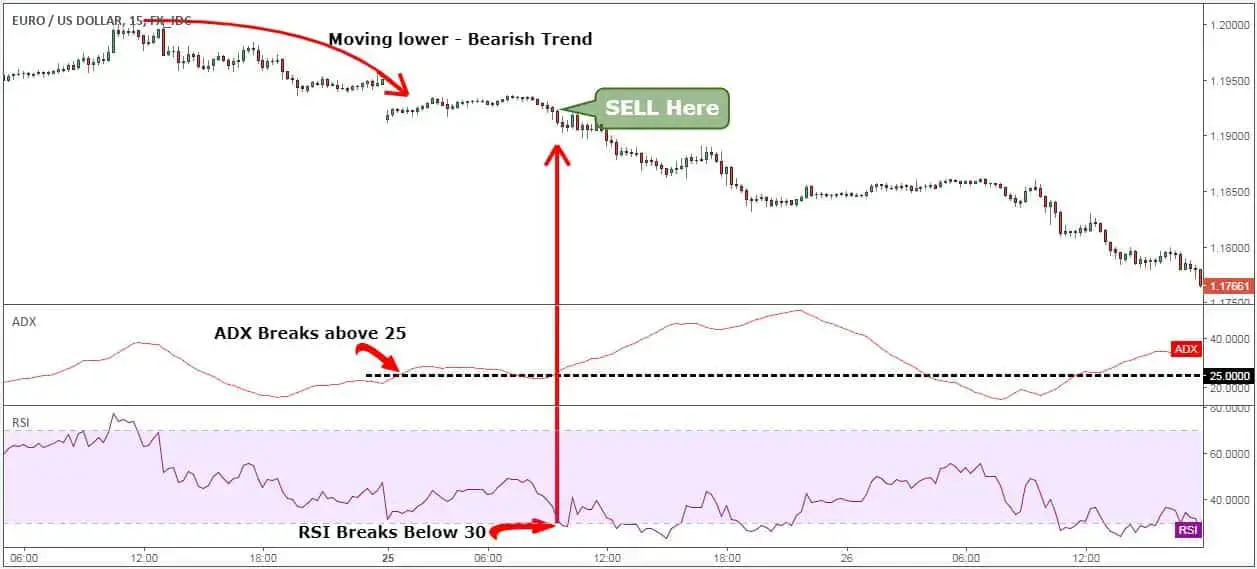
Step 3: Sell the stock whenever the RSI indicator falls below 30.
The RSI indicator, which has the same properties as the ADX indicator, will be our entry signal. When the RSI indicator goes below 30, the market is often oversold and in a reversal pattern. However, intelligent trading demands looking beyond the words of the textbook.
The ADX indicator depicts a strong trend, which is exactly what we want to see. We would want to see more sellers in the marketplace.
Step 4: At the most recent ADX high, place a protective stop loss.
Find the moment at which the ADX reached its ultimate high before our entrance to determine the best stop-loss location for our ADX approach. Second, choose your stop-loss level by comparing the price chart’s relevant high to the ADX high.
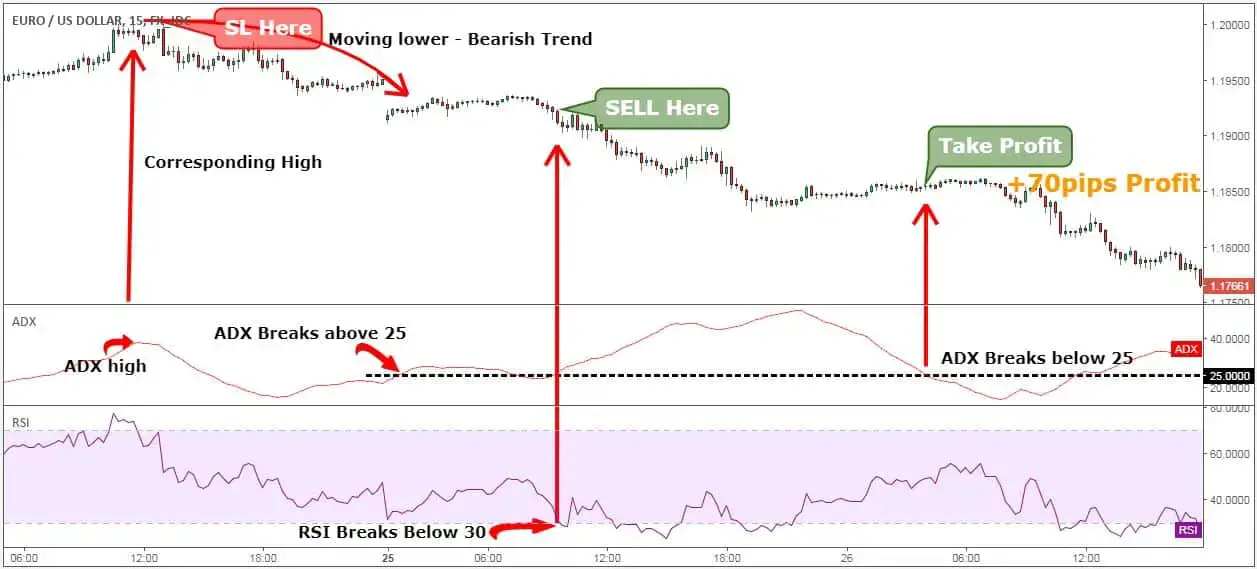
Step 5: When the ADX indicator goes back below 25, it’s time to grab profits.
The ideal ADX strategy seeks only benefits that come from the presence of a strong trend. We aim to take profits and hold off on trading until the chance of a strong trend decreases.
In order to do this, we begin taking profits as soon as the ADX indicator drops below 25.
An ADX rating that falls below 25 suggests that the dominant trend is weakening.
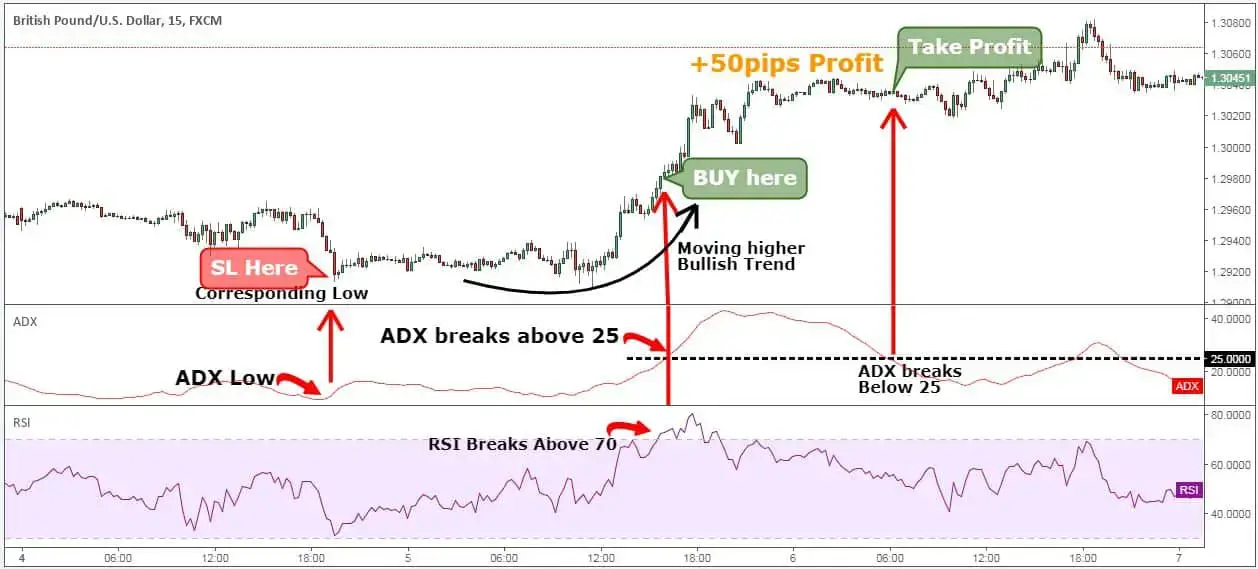
Note: The trade indicated above was a SELL transaction according to the ADX indicator trading recommendations. For a purchase trade, use the same rules, but in reverse. The graphic below depicts a genuine purchase transaction.
ADX Trading : Frequently Asked Questions
How does ADX get computed?
To calculate ADX, divide the difference between the DI+ and DI-indicators by the total, then multiply by 100. The result is an index with values ranging from 0 to 100.
How do I use ADX for my day trades?
When utilizing ADX for day trading, one may identify key market trends and enter trades along those lines. Additionally, traders may use ADX to identify potential trend reversals and set stop-loss levels.
What ADX settings work best for a 5-minute chart?
Depending on the trader’s trading style and preferences, the appropriate ADX values for a 5-minute chart may differ. Nonetheless, the period of 7 and the threshold level of 20 are two often used quantities.
Which ADX settings are appropriate for a one-minute chart?
Depending on the trader’s trading style and preferences, the appropriate ADX values for a 1-minute chart may differ. Nonetheless, set the duration to 3 and the threshold to 10.
What ADX settings work best for a 15-minute chart?
Depending on the trader’s trading style and preferences, the appropriate ADX values for a 15-minute chart may differ. Nonetheless, 14 and 25 are often chosen as threshold and durations, respectively.
In Conclusion,
Because traders often do not want to invest in anything that is static or not significantly moving, the best ADX technique offers us with really useful information.
Using ADX indicator trading concepts, one may make a rapid profit by riding the strength of the trend. In conclusion, identifying strong trends offers the most returns, and adopting the ideal ADX technique can help you reach your trading goals.
Follow for the latest news and information Telegram Channel



