

It is straightforward to understand how professional traders use CCI trading strategies. This post will also explain the CCI indicator and how to utilize it in trading.
If this is your first time on our website, our team at Doughvest welcomes you.
What is the CCI, or commodity channel indicator?
Donald Lambert developed the CCI indicator, which was first intended to identify cycles in the commodities market. That works similarly in the stock market, the forex market, and even the cryptocurrency market.
As you may have predicted, the CCI indicator is all you need to detect new market cycles.

The CCI indicator technique was designed to detect cyclical market patterns and act as a bearish or bullish filter. The CCI is a basic oscillator indicator that typically ranges from +100 to -100.
A positive score greater than +100 signifies the start of an uptrend, while a negative reading less than -100 suggests a bearish indicator.
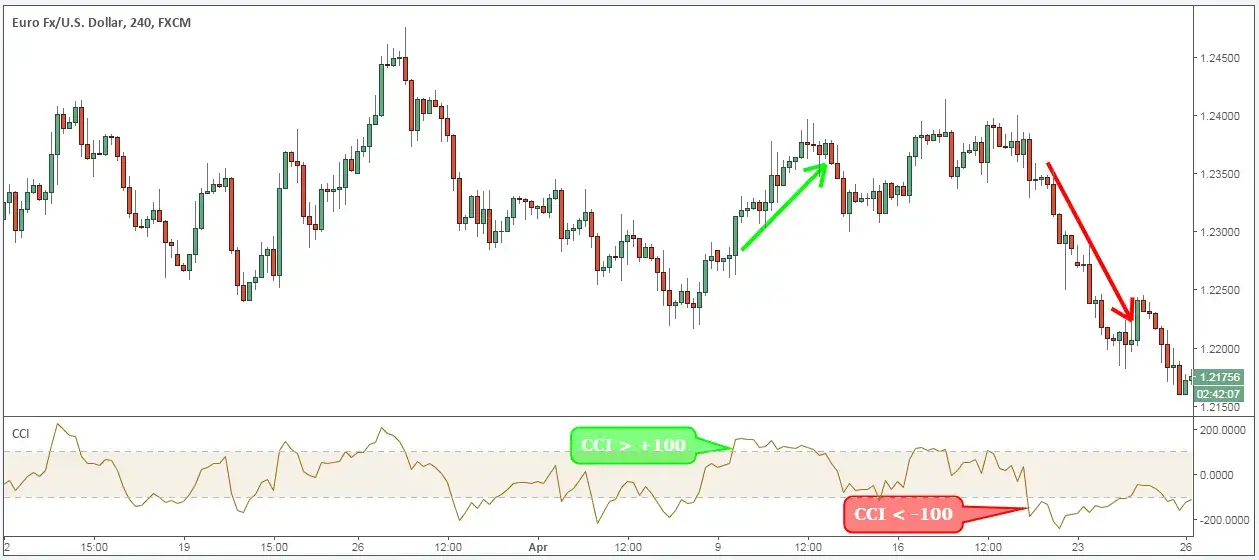
Remember that technical indicators are simply mathematical calculations. It does not, however, lag the price since the CCI is a leading indicator.
Moving ahead…
So let’s see how a complete newbie may read the CCI indicator.
This method is also useful for assessing any market.
To trade our CCI trading approach, we employ Donald Lambert’s CCI indicator.
CCI Indicator Trading Guide
The zero line in the CCI indicator marks the boundary between bulls and bears.
This means that by waiting for the zero line to cross, we may be able to detect a change in market mood.
As a result, the CCI indicator may be employed in trading as follows:
- The CCI oscillator passes the zero line, indicating a change in momentum from negative to positive.
- The CCI oscillator crosses over the zero line, indicating a change in momentum from bullish to negative.
How is the CCI indicator determined?
The formula for the CCI indicators is:
CCI = (Typical Price minus 20-period SMA of TP) / (0.015 x Mean Deviation)
Where:
Typical Price (TP) = (High + Low + Close)/3
To ensure that the CCI value does not often fall between -100 and +100, the CCI formula has a constant of 0.015. However, it goes without saying that other variables, such as look-back time, influence CCI values.
In this sense, as the look-back period increases, a greater proportion of the CCI values will fall between -100 and 100. You should have considered this before submitting the CCI indicator settings.
Moving ahead…
Let us look at three reasons why traders use the CCI indicator.
Reasons why traders use the CCI indicator
The CCI indicator may be an effective tool for detecting and trading positive trends.
However, the CCI indicator may be used for different reasons, such as:
- Indications of excessive purchasing activity
- Signs of strong selling pressure
- Divergence is the process of migrating or spreading away from a central point or route.
The CCI indicator has several limitations, just like any other technical indicator. Thus, avoid selecting CCI signals at random.
Here’s a simple CCI day trading approach to get you started.
View below:
Day trading requires active trade management. Because of the high risk associated with day trading, you must utilize trading tactics that are fit for that trading style.
Traders may use the CCI indicator in a number of ways.
However, at Trading Method Guides, we have developed a day trading CCI method using just five conditions:
- The 5-minute chart is the optimal time frame.
- To decrease the bulk of intraday noise, we will use CCI values of +200 and -200.
- Wait until the CCI indicator registers two consecutive overbought (oversold) readings above +200 (below -200).
- Look for price/CCI divergences.
- Wait till the CCI crosses below +100 (above -100).
Tired of losing trades? Open a Libertex account to start trading stocks and forex with the professionals today.
How Professional Traders Use the CCI Indicator Strategy
The CCI trading approach does not check for overbought or oversold indicators. You must realize that when the CCI value exceeds +100, we are really exhibiting strength. To put it another way, the market’s total vitality is increasing.
We normally recommend writing the entry method guidelines on a piece of paper with a pen before beginning.
For this article, we’re going to look at the buy-side.
Step 1: Hold off until the CCI indicator rises over the +100 mark.
It shows statistically that the EUR/USD has gained greater strength than usual, making it ideal for buying opportunities when the CCI value exceeds +100.
The commodity channel indicator, as a leading indicator, has the ability to offer us better trading indications.
The CCI will signal the start of a new bullish trend or, at the very least, a rise from which you may profit judiciously when it crosses the +100 level for the first time.

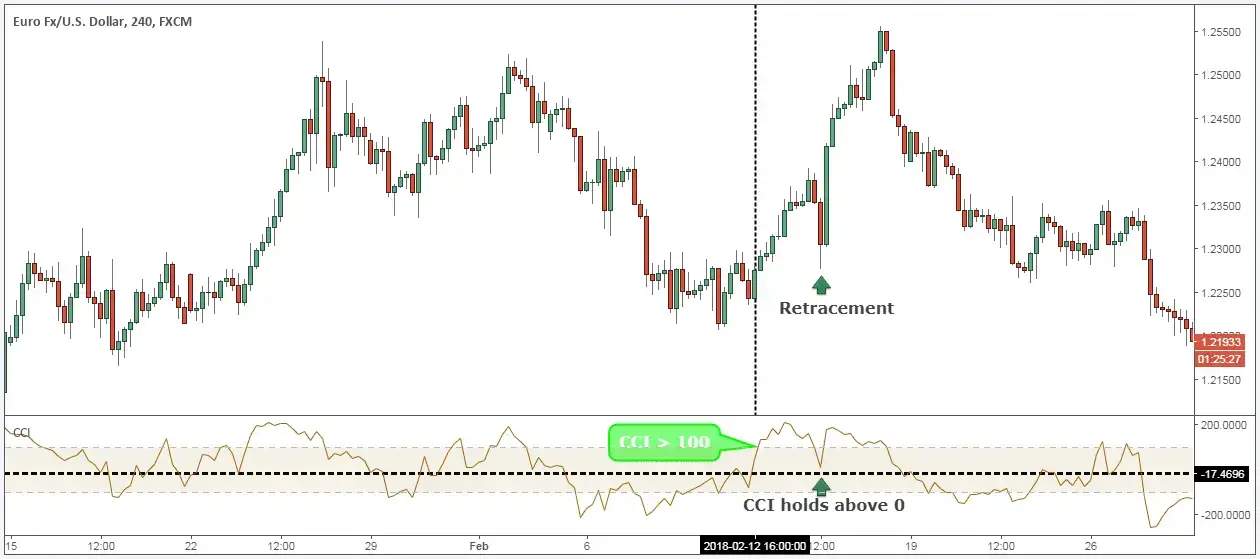
Step 2: Keep an eye out for retracements and ensure that the CCI indicator remains above the zero line.
Waiting for a price drop is a safer trading strategy. On the other side, you might buy quickly if the CCI rises above +100. In this circumstance, you must guarantee that there is adequate time between now and the final incident of the CCI exceeding +100.
Using the more conservative method, we will look for a downturn and keep the CCI indicator above the zero line throughout.
5 CCI Indicator Trading Strategies: How Experts Trade
This is where it gets important. The CCI indicator should show a slight retracement that just touches the +100 level, but we also need to see more retracement in the price action than the CCI did.
If we are going to buy EUR/USD, we want to see strength to the upside and prolonged strength in the CCI reading when the price is reversing. It is important to keep the CCI indicator above the zero line during the retracement.
If the CCI crosses below the zero line during the retracement, we are no longer interested in going long EUR/USD.
This is a great example of how to distinguish between smart and dumb trades.
The stronger the rally should be, the lower the CCI should turn down.
Step 3: Purchase three or five candles’ “worth” of retreat. Alternatively, the closing price is utilized to buy sharp corrections.
Currently, we’re looking for long trades.
We may join the market in any of two ways.
We buy straight away, either after the market has pulled back over the preceding three to five candles or if there is a quick correction.
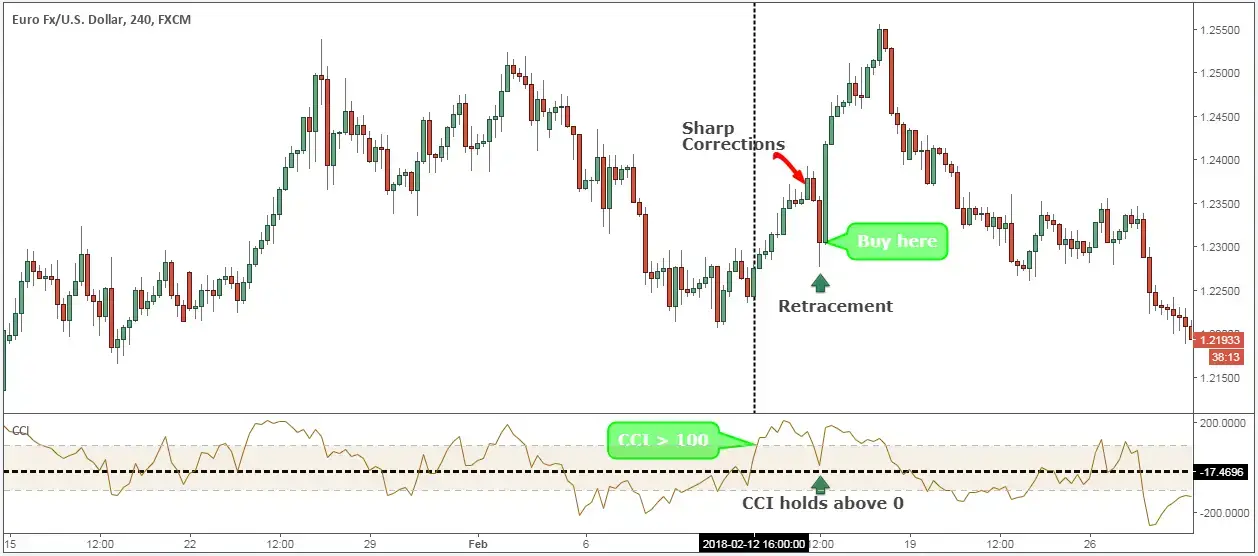
These tiny pullbacks give the market’s natural ebb and flow, which we’ll use to pace our entry.
A little retracement implies that the market’s current impetus is still rising. The actual buying and selling pressure occurs behind the scenes, and the CCI indicator approach correctly reflects this.
This brings us to the second critical choice we need to make regarding the CCI trading strategy: where to place our safe-stop loss.
Step 4: Place a protective stop loss below the swing low that occurred most recently.
Our solution for limiting your stop loss is quite straightforward. All you need to do is place your protective stop loss below the previous swing low.
You may end the transaction at the market price if the CCI did not fall below the -100 line after you entered the market to trigger your stop loss. It is critical to monitor the CCI indicator for any more indications of weakening.

Finally, while trading using the Commodity Channel Index indicator, we must indicate when and how we want to collect winnings.
Check it out below:
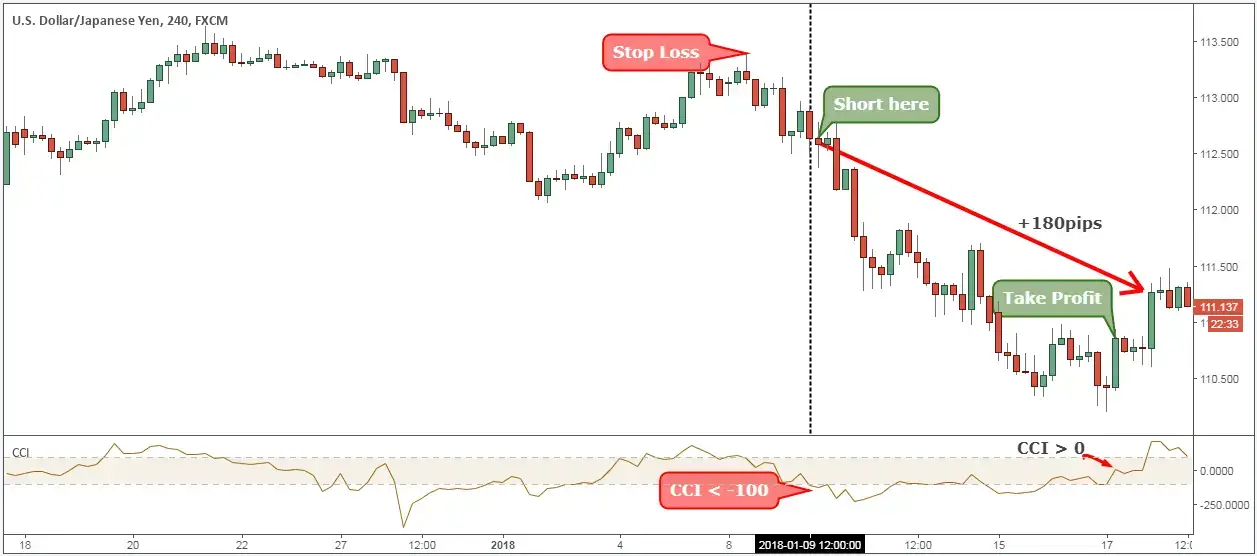
Step 5: Consider taking a profit if the CCI reaches 200 or falls below zero. Whatever happens first.
When it comes to exits, we have two trading techniques available.
Taking profits when the CCI hits +200 is the most profitable exit strategy. However, since the market will not always supply us with such many trading opportunities, we must be prepared.
Thus….
We want to exit our trade as soon as the CCI indicator crosses below the zero line. When the CCI indicator falls below zero, it is the first sign that the rally is losing momentum.

Please keep in mind that the trade highlighted above was a buy executed with our CCI trading strategy. For a SELL transaction, follow the same steps, but in reverse. The image below depicts a genuine SELL trade.
What is the best time period for trading using the CCI indicator?
Depending on your trading style, there are numerous optimum moments to employ the CCI indicator. Day traders often utilize 5-minute charts or shorter time periods. Higher time frames, on the other hand, may provide better results since they correlate to longer market cycles, which benefits swing or position traders.
Can the CCI indicator be used to trade any market?
Indeed, the CCI indicator is versatile and beneficial in a range of markets, including stocks, currencies, commodities, and even cryptocurrency. Although it was initially designed to identify cycles in the commodities market, it has been successfully applied to other markets as well.
What distinguishes the CCI indicator from other oscillators?
The CCI indicator stands out since it is a leading indicator that does not lag behind the price. Unlike many oscillators, the CCI normally oscillates between +100 and -100, providing bullish and bearish indicators based on these levels. Because of its unique algorithm, it can also detect cyclical trends in the market.
Is the CCI indicator sufficient to make trading decisions by itself?
Even though the CCI indicator is reliable, it should not be used as your only source of information for making trading decisions. Combining CCI signals with price action analysis and other technical indicators may provide a more comprehensive picture of the market, allowing traders to make more informed decisions. The divergence between the CCI and price activity is an essential factor to consider while developing your strategy.
Is scaling effective with the CCI indicator?
Indeed, the commodities channel index (CCI) indicator might be effective for scalping strategies. The CCI indicator is a handy tool for scalpers, who conduct a large number of trades for little returns over short periods of time in an effort to forecast short-term price fluctuations and potential entry and exit points. Because the CCI is sensitive to price swings, it may be utilized to catch quick movements in a scalping situation. Your method is based on the CCI’s divergence from price movement.
Finally, CCI Indicator Strategy
You may incorporate the fundamental concepts of the CCI approach into your own trading strategy. Because all markets move in cycles, we recommend using the CCI indicator in combination with larger time frames to optimize trading performance. Our backtesting results corroborate this advice.
Follow for the latest news and informationTelegram Channel



