What is a Pattern?
Patterns are the distinctive formations created by the movements of security prices on a chart.
A line that connects frequent price points, such as closing prices or highs or lows during a given time period can be used to identify a pattern.
These price points can be highs or lows throughout that time period. Chartists strive to find patterns as a technique to foresee the future direction of a security’s price. Patterns are the foundation of technical analysis.
KEY POINTS
- Trading patterns can deal with past price trends of an asset. Examples for stocks would include: historical stock prices, moving averages, and post earnings stock swings.
- Other types of patterns, such as those dealing with macro data points, should also be considered. Examples of this would be the way in which the price behaviour of the entire market is acting, the question of whether or not a group is breaking out or down, and any other historical tendencies that a trader notices.
How Patterns Work
Patterns in security prices, perhaps better known as trading patterns, can occur at any point or measure in time.
Price trends may be easy to recognize when looking back on historical data, but recognizing them in real time can be a far more difficult task.
In technical analysis, there are many different types of patterns, some examples of which are the head-and-shoulders pattern, the ascending/descending channels pattern, and the cup-and-handle pattern.
There are two primary types of stock analysis: fundamental and technical.
Fundamental analysis looks at the intricacies of a company’s operations, including research on earnings estimates, balance sheets, price-to-book ratios and much more.
Technical analysis is largely engaged with pattern recognition, regardless of performance. These patterns are then used to uncover pricing trends.
Fundamental analysis can help determine what to buy, while technical analysis can help determine when to buy. Both of these studies should be used by well-rounded investors.
Technical analysts analyze chart patterns to discover trends in the movement of a company’s stock price.
Patterns can be based on seconds, minutes, hours, days, months or even ticks and can be applied to bar, candlestick, and line charts.
A trend line is the most fundamental type of chart pattern there is.
Trend Lines
The phrase “the trend is your friend” is a slogan that is frequently used by technical analysts. A trend can often be detected by generating a line chart.
The line that is drawn between a high and a low is known as a trend line. If that line is moving higher, the overall trend is moving higher.
If the trend line is sloping in a downward direction, then the trend is going in a downward direction. The majority of chart patterns are built upon trend lines as their basis.
They are also helpful for determining support and resistance levels, which can also be found using pattern recognition.
These levels can be identified through pattern recognition. A historical level that a stock price hasn’t traded below is referred to as a line of support, while a historical point that a stock price hasn’t traded above is referred to as a line of resistance.
Tired of loosing trades? Open a Libertex Account to start trading stocks and forex with the professionals today.
Pattern Types
Patterns can be broken down into two primary categories: continuation and reversal.
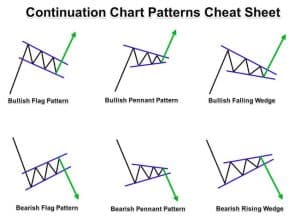
Traders can spot opportunities to continue with an existing trend by looking for continuation patterns.
There are other instances of stocks not continuing with the trend, which are referred to as retracements or transitory consolidation patterns.
The most typical continuation patterns are symmetrical triangles, flag patterns, pennant patterns, and ascending and descending triangles. Flag patterns and pennant patterns are also prevalent.
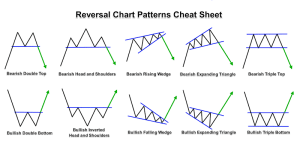
A reversal pattern can be thought of as the antithesis of a continuation pattern. These are used to locate profitable opportunities to base a trade on the reversal of an existing trend in a market.
In other words, the purpose of reversal patterns is to discover where previous trends have come to an end.
Another popular catchphrase for those looking for a reversal in a trend is “The trend is your friend until it bends.”
“The trend is your friend until it bends” The head-and-shoulders pattern, the double tops and bottoms pattern, and the triple tops and bottoms pattern are all examples of common reversal patterns.
Follow for the latest news and information Telegram Channel


