This essay is mostly intended for traders who are new to the market. In it, I’ll attempt to explain how to design trend lines and trend channels in a more accessible and clear way. We will be drawing the Trend lines using the broker Libertex
A trend in Forex, like in other markets, refers to the movement’s direction. Prices are either going up or down in our situation. Only 30% of the time, according to data, the markets are in a trend; the remainder is flat (sideways movement).
An upward price movement is referred to as an uptrend.
In a downtrend, price movement is downward.
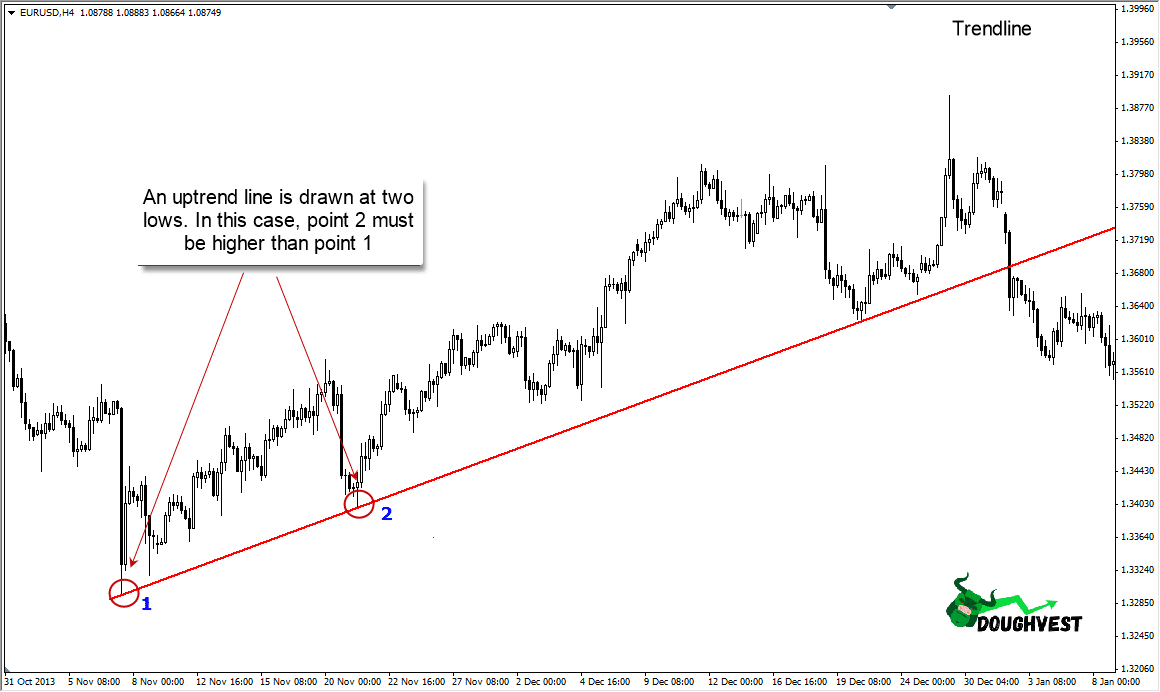
What is the best way to create an uptrend line?
Constructing trend lines and channels may be done in a variety of ways. I’ll show you how to utilize the right one, which I do myself.
The lows form the foundation of an uptrend, with each succeeding low needing to be higher than the one before it.
Only two points, or minimums, are required to create a line.
You may wonder why we’re building on the lows, but it’s because in an uptrend, the trend line will function as support and guide us, and its collapse will alert us to a probable trend change:
What is the best way to create an uptrend channel?
Two lows and one high are sufficient to form an upward channel.
We make a link between the lows. This has already been accomplished (screenshot above). We merely need to draw a line across the maximum point, parallel to the trend line (point 3).
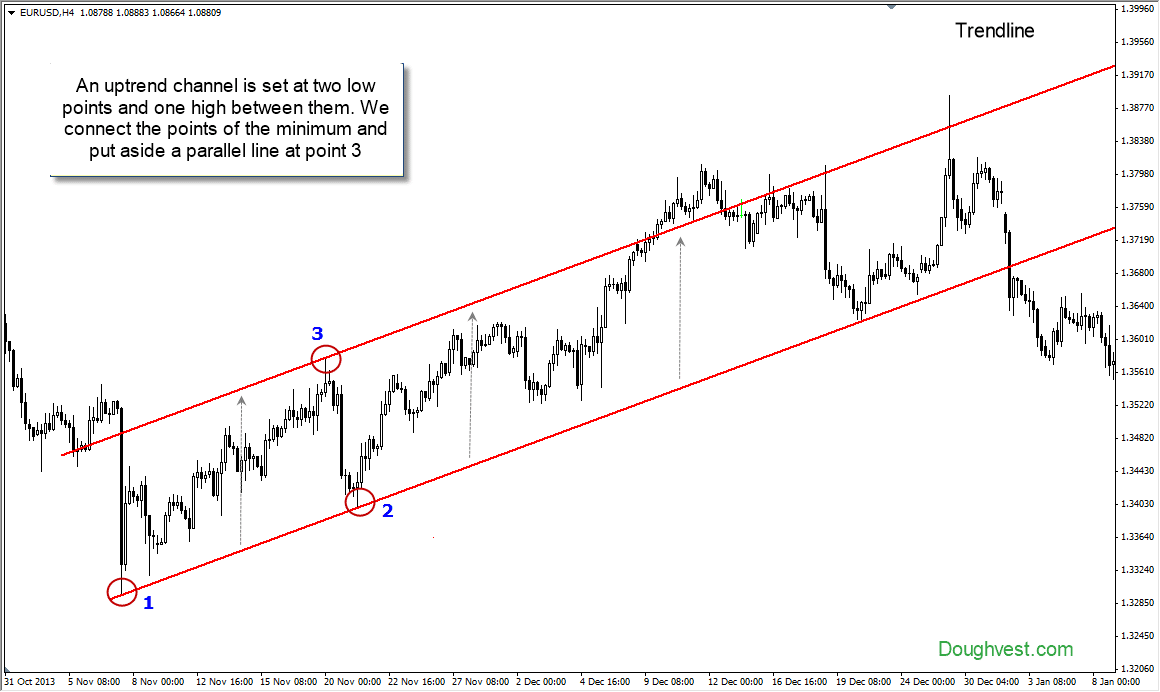
We have an upward-trending channel. The lower line will now serve as our support, while the higher line will serve as resistance, and in order to surpass them, major participants, such as market makers, will have to exert significant effort.
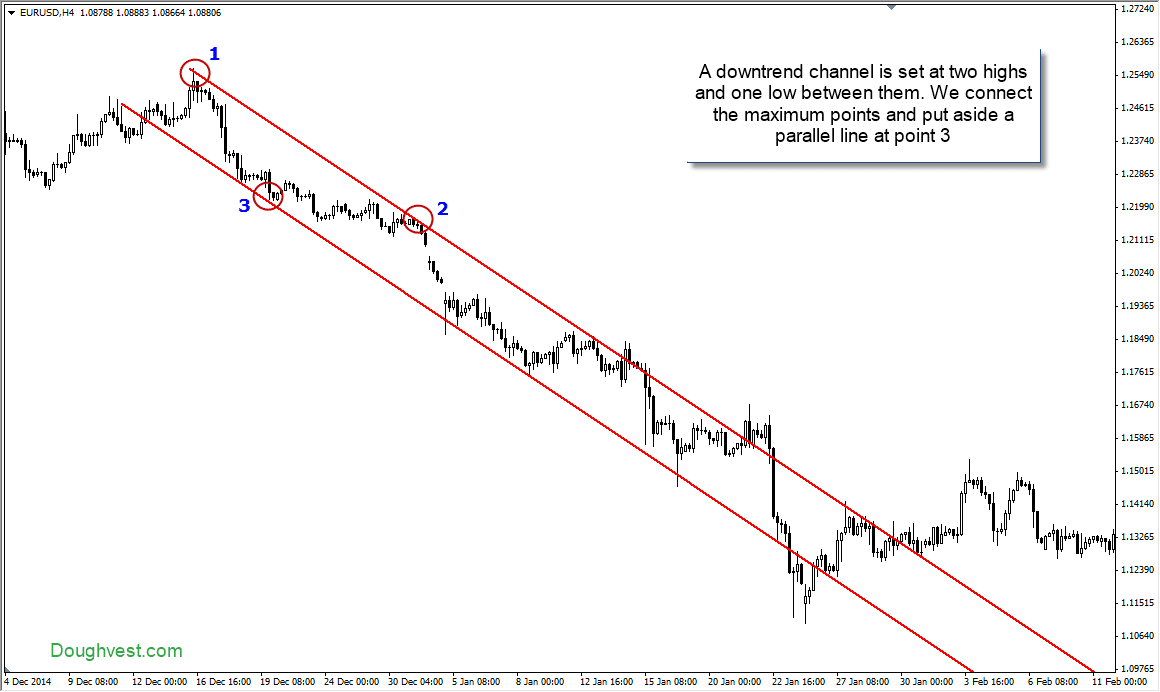
What is the best way to create a downtrend line and channel?
The highs provide the foundation of a downtrend, and although each succeeding high must be lower than the preceding one, two highs are sufficient to plot.
Let’s start with a downtrend. Connect the two maximum points on the chart that match our criteria (the second maximum is below the first) with a line.
The trend line serves as a breakout resistance for us in this case, indicating a likely trend shift.
To avoid cluttering the post with superfluous screenshots, we’ll create a downtrend channel right away by drawing a parallel line across the minimum, which is halfway between our two highs:
We created two channels, one rising and the other descending, and as you can see, the price respected their bounds by bouncing off them, breaking through in certain areas, and then returning to the channel.
A sense of tension was produced at the intersections of these lines in certain locations; the price appeared to follow the fence, seeking for a way to get outside the channel barrier (it was not always possible).
Advice:
1. Compare the trend direction in the chosen period to the trend direction in higher time frames.
2. Don’t take the phrase literally, and don’t bind it to a fixed price.
Draw them carefully according to the highs and lows, but don’t assume the price should contact them at each point. Consider their borders to be a pricing range (within these lines).
3. Trend lines are possible resistance and support lines. It’s important to remember that getting over this resistance requires the efforts of market makers. It’s crucial to remember that the price always advances in the direction of least resistance.
If the price advances to the resistance line, for example, this line has amassed a large number of orders to terminate trades (sell). You not only draw trend lines accurately, but you also understand them.
And, in order for market makers to drive the price higher (break through resistance), they must absorb all open sell orders, which necessitates a big amount of money.
If they don’t want to be a part of the movement, the price will bounce off the barrier.
4. Always create trend lines and channels.
Always keep these in mind while planning your trading strategy.
Keep in mind that trading with the trend can help you save money.
Categories Of Trends
Trends are divided into three categories:
- long-term;
- in the medium term;
- Short-term;
One thing is true here, but how can you know if the trend is short-term or medium-term?
After all, the weekly chart’s short-term trend is medium-term on the daily chart and long-term on the hourly chart.
It turns out to be some type of wanderer, and without a bottle, you can’t figure it out. To clear up any ambiguity, I recommend that you do the following:
-A short-term trend is defined as one that is narrow, steep (big angle), and is replaced by a counter-trend in a short period of time.
This is a medium-term trend if it is created over an average time span (H1, H4).
Daily, weekly, and long-term charts are all available.
Shorter trends may be found inside the major trends, shortening the timescale down to the minute, but without fanaticism. The most important thing is to not overdo it and to treat them with greater patience.
Build a trend channel on an hourly period if you trade it.
It will be your major channel but look at the upper periods as well, since if it keeps up with them, it will gain greater relevance and power. Join Doughvest Telegram channel for market updates.


