

Introduction
Moving averages are used extensively in technical analysis because they help traders comprehend market conditions by smoothing out price data and reducing short-term volatility. Traders use them to determine dynamic support and resistance levels, as well as if a market is trending.
One of the primary tasks of any market analyst is to determine the market’s exact activities. Is it trending, consolidating, rising, or falling? How do you know too? Moving averages are the most common starting point for analysis. Indeed, a market trading above its 200-day moving average is often seen as being in a bull market, but the converse is true in a bear market.
Moving averages are also often employed by traders as the basis for trend-following trading systems, in which an entry signal is generated when a shorter-term moving average crosses over a longer-term average. You can also read ; Average Indicator and why you should start using them now
Important takeaways
- Moving averages help identify trends by smoothing out price data.
- Moving averages are classified into two types: exponential moving average (EMA) and simple moving average (SMA).
- Moving averages, especially in trending markets, may reveal levels of support and resistance.
- Price crossovers and dual moving average crossovers are both instances of techniques.
- Combining moving averages with additional indicators may help enhance trading signals.
Understanding the Definition and Application of Moving Average
A moving average eliminates noise by averaging prices over a defined time period, assisting traders in evaluating whether a market is trending. They are “moving” because they are calculated using the most current price data on a continual basis. In moving markets, they often function as both resistance and support. Traders also look for crossings, which indicate a trend shift.
Moving Average Types
The most often used moving averages are
- The SMA, or simple moving average
- EMA, or exponential moving average.
- WMA, or weighted moving average.
- SMMA, or smoothed moving average.
The SMA, or simple moving average
The average closing prices over the preceding n periods are represented by the SMA. It displays the average price change over time as a smoothed line. A moving average is produced by dropping older data as fresh data is added. Since closing prices constitute the basis for the majority of moving averages, just one data point each day is required. A 10-day SMA, for example, would be calculated by dividing the closing price of each of the ten days prior by 10. As each new day is added, the oldest date is subtracted from the computation, resulting in an average that “moves.”
Every data point within the timeframe has an equal weight when using the SMA. As a lagging indicator, the SMA responds to price fluctuations somewhat slowly.
One
Moving Average Exponential (EMA)
A weighted moving average, the EMA prioritizes recent price data. This feature helps to lessen the lag since it responds to price movements faster than the SMA.
The EMA is calculated in three steps:
Please determine the SMA average first. For the first EMA value, this number is used.
Please proceed to identify the weighting multiplier and calculate it.
Third, please calculate each day’s EMA.
Compute:
Ten-period initial SMA
2/(Time periods + 1) = (2/(10 + 1)) = 0.1818 or 18.18% is the multiplier.
EMA is calculated as (Close – EMA from the day before) x multiplier + EMA from the day before.
Because it detects momentum shifts before the SMA does, the EMA enables traders to react to price fluctuations more rapidly. But in volatile markets, it also produces more misleading signals.
Moving Average Weighted (WMA)
The WMA gives more weight to current price data than the EMA does. The weights of the values are, however, linearly rather than exponentially modified, in contrast to the EMA.
The WMAs and the EMAs’ traits are quite comparable. However, there is a variation in their computations. WMAs are less dynamic than EMAs and linearly smooth out price data.
Tired of losing trades? Open a Libertex account to start trading stocks and forex with the professionals today.
Moving Average Smoothed
With a stronger smoothing effect, this Smoothed Moving Average is a variant of the SMA and the EMA. Compared to the SMA and EMA, it is more successful in reducing price volatility and market noise because it incorporates more historical data into its computation.
The smoothed moving average removes a lot of noise and incorporates more data than the WMA, EMA, and SMA. It also makes it slower to respond to changes in pricing.
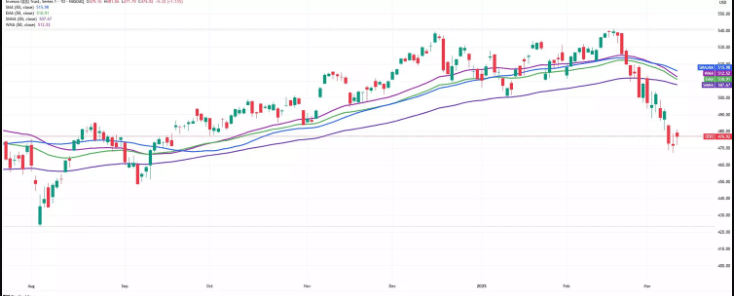
How to Use Moving Averages to Determine Stock Trading Trends
Moving averages are ideal for identifying market trends. This is why nearly all market analysts use them, and they are often the first indicator to emerge on a price chart.
Momentum favors buyers as long as the price remains above the rising moving average, indicating an uptrend. When the moving average falls, it indicates a downtrend. A flat moving average implies that the market is likely to stabilize, rendering trend-following strategies worthless.
Resistance and Support Levels.
MAs may also function as dynamic levels of support and resistance in volatile markets. During an upward trend, they may operate as support since the price often rebounds off the large moving averages, providing trading opportunities. In a downtrend, MAs may be used as resistance levels to suggest selling pressure and prevent breakouts.
Moving averages are a self-fulfilling prophecy, which is at least partly explained by traders’ belief that they will always offer support and resistance. To put it another way, traders will tend to enter (or exit) at a point when everyone feels the price will reverse.
Furthermore, price typically reacts differently around different moving averages depending on the intensity of the trend and the time range (20, 50, or 200 periods). At the 20-day mark, for example, it may face resistance or support before quickly turning around and reverting to its previous pattern. The longer-term trend is projected to continue after a period of consolidation around the 50-day or 200-day moving averages.
Ways to Use Moving Averages
Moving averages are best used for trading system execution in trend-following or as support or resistance during countertrend pullbacks, rather than just acquiring a market read.
Price changes.
When a price crosses over a moving average, it may signal that the trend will continue or reverse. A bullish crossover occurs when the price rises above a moving average, indicating the possibility of upward momentum. When the price goes below a moving average, it is referred to be a bearish crossover and indicates a possible downturn.
For example, following a market decline, an asset reclaims its position above its 20-day EMA. It might be considered a positive indicator, indicating that upward momentum is likely to follow. Risk may be reduced by placing a stop-loss order immediately below the 20-day moving average.
Price crossings are often employed as a filter by traders. For example, it would be silly from a technical standpoint to short an asset rising over a 20-day SMA that is slowly advancing, and vice versa.
Moving Averages: Advantages and Drawbacks
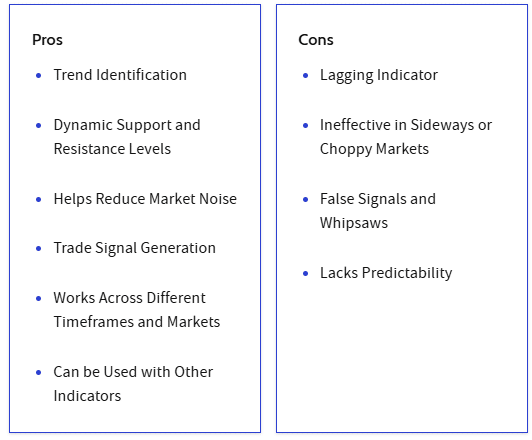
Moving Average Techniques.
Putting Other Indicators together
By minimizing false signals, integrating MAs with other indicators enhances accuracy. It also helps to confirm trends. Furthermore, volume analysis confirms MA crosses since low volumes might indicate a false breakout, whereas strong volumes support bullish or bearish moves.
While the Relative Strength Index (RSI) ensures that MAs indicate trades when there is positive or negative divergence, the Moving Average Convergence Divergence (MACD) helps to validate momentum changes. By verifying breakouts, Bollinger Bands help traders avoid weak signals in sluggish markets. By altering MA sensitivity based on volatility, Average True Range (ATR) ensures that traders use longer MAs in turbulent markets and shorter MAs in tranquil ones.
The Bottom Line
Moving averages are very useful for determining the market’s condition. However, risk management and market circumstances influence their effectiveness as trading signals. Traders vary the kind of moving averages and the number of periods they use based on their trading strategy. Traders often combine them with additional indicators like Bollinger Bands, RSI, and MACD.
Finally, since MAs often lag in turbulent markets, combining them with risk management tactics like position size and stop-loss orders ensures superior decision-making.
Follow for the latest news and information.Telegram Channel



